


 Top Rated Course

We may not have the course you’re looking for. If you enquire or give us a call on 01344203999 and speak to our training experts, we may still be able to help with your training requirements.
Top 20 Business Analysis Tools for Modern Business Analysts
The Knowledge Academy 27 August 2026Explore the top Business Analysis tools that help professionals manage requirements, analyse data, improve processes and support better business decisions.
Training Outcomes Within Your Budget!
We ensure quality, budget-alignment, and timely delivery by our expert instructors.
Table of Contents
Related Courses

Imagine a Business Analyst is helping a retail company reduce delays in its online order process. So, here's what happens:
1) Customer complaints are stored in emails
2) Order data is stored in Excel
3) Process steps are documented in Word
4) Project updates are tracked separately
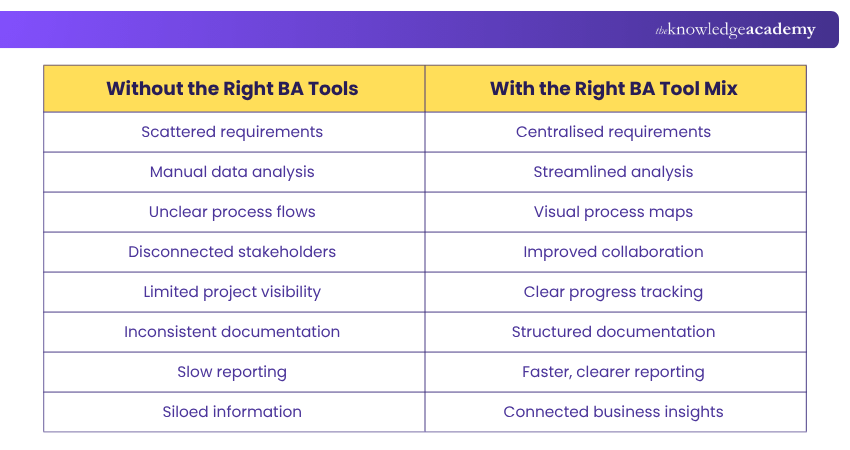
To understand what is going wrong, the analyst may use Excel or SQL to examine order data, Visio to map the current process, Power BI to present performance trends and a work management tool to track improvement actions.
This is where Business Analysis tools make a difference. Since no single tool can support every activity, knowing which tool to use and when is equally important. This blog explores 20 popular Business Analysis tools and how they can support different analysis activities. So, read on!
What are Business Analysis Tools?
Business Analysis Tools are software applications and platforms that help Business Analysts collect requirements, analyse data, model processes, document findings and communicate insights. They make it easier to organise complex information, identify business needs and support informed decision-making throughout an analysis or project.
These tools can serve different purposes depending on the task. Some focus on specific activities, such as process modelling or data visualisation, while others support requirements management, collaboration, reporting and workflow tracking. Choosing the right tools can help analysts work efficiently and turn business requirements into practical solutions.

Types of Business Analysis Tools
Business Analysts perform different activities throughout their work. As a result, Business Analysis Tools can be grouped according to the purpose they support:
1) Requirements Management Tools
Requirements Management Tools help analysts capture, organise and track business and stakeholder requirements. They can be useful when requirements change during a project and different teams need access to the latest information.
Best for: Requirements traceability, change control and stakeholder validation.
2) Process Modelling and Diagramming Tools
These tools help Business Analysts convert processes, systems and relationships into visual diagrams. Flowcharts, process maps and other models can make complex information easier for stakeholders to understand.
Best for: Business process analysis, gap identification and process redesign.
3) Data Analysis and Visualisation Tools
Data Analysis Tools help Business Analysts examine and interpret business information. Visualisation platforms can then convert this information into dashboards, charts and reports.
Best for: Data exploration, performance analysis and insight reporting.
4) Collaboration and Documentation Tools
Business Analysts regularly work with managers, customers, developers, testers and other stakeholders. Collaboration and documentation tools help teams share information, capture discussions and maintain records.
Best for: Meeting notes, shared documentation and stakeholder feedback.
5) Project and Work Management Tools
Although Project Management is not normally the primary responsibility of a Business Analyst, analysts often need visibility of tasks, deadlines and project progress. Work management tools can help organise responsibilities, monitor activities and support coordination between teams.
Best for: Work prioritisation, progress monitoring and team coordination.
Use this below image to identify the type of Business Analysis tool that best fits your task:
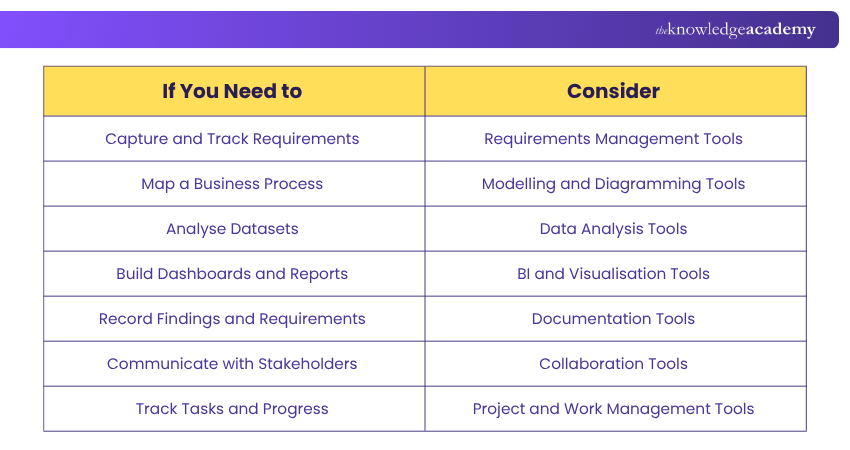
Top 20 Business Analysis Tools
The right tools can make Business Analysis more structured, efficient and collaborative. Let’s explore 20 tools commonly used across different analysis activities:
1) ClickUp
ClickUp is a useful Business Analysis Tool primarily used for Project Management. It provides a holistic view of all the ongoing tasks. It offers comprehensive Time and Task Management and also facilitates collaboration between different units in a business.
Key Features:
a) Task and Subtask Management: Break complex activities into tasks, subtasks and nested subtasks so requirements, actions and deliverables are easier to track.
b) Search and Filtering: Find specific tasks and organise work using filters, tags and other task information.
c) Checklists and Templates: Create repeatable checklists and templates for recurring processes such as reviews, requirement checks or project activities.
d) Team Collaboration: Keep comments, documents, attachments and task updates connected to the relevant work.
e) Integrations: Connect ClickUp with other workplace applications to reduce the need to move information manually between systems.
2) Confluence
Confluence is a collaborative workspace that helps Business Analysts document requirements, organise project information and share knowledge with stakeholders. It provides a central location where teams can maintain documentation and access updated information throughout a project.
Key Features:
a) Requirements Documentation: Record business requirements, project details and supporting information in structured pages.
b) Page Templates: Create consistent documentation using templates for requirements, meetings and project plans.
c) Version History: Review previous versions of pages and track how documentation has changed.
d) Team Collaboration: Allow stakeholders to comment, edit and provide feedback on shared content.
e) Jira Integration: Connect documentation with Jira issues, user stories and project activities.
Pro Tip
Do not start by comparing every feature. Identify your main Business Analysis activity first, shortlist tools built for that purpose and then compare the capabilities that matter to your workflow.
3) MS Excel
Microsoft Excel is widely used for storing, organising and analysing structured information. Business Analysts can use formulas, tables, filters and charts to examine business data. Business Analysts use it because its flexibility makes it useful for quick analysis, calculations and smaller datasets.
Key Features:
a) Data Organisation: Structure large amounts of information using worksheets, tables and named data ranges.
b) Sorting and Filtering: Narrow datasets according to selected conditions so analysts can focus on relevant information.
c) Formulas and Functions: Perform calculations and transform data using built-in mathematical, statistical and logical functions.
d) Charts and Visualisations: Turn spreadsheet data into charts that make patterns and comparisons easier to communicate.
e) Pivot Tables: Summarise and explore datasets from different perspectives without manually rebuilding calculations.
4) MS Word
Microsoft Word can be used to document requirements, findings, reports and other Business Analysis information. Its commenting and collaboration capabilities can also help stakeholders review documents and provide feedback.
Key Features:
a) Structured Documentation: Create requirement specifications, business cases, reports and other formal Business Analysis documents.
b) Comments and Review Tools: Allow stakeholders to provide feedback without directly changing the original wording.
c) Track Changes: Record document revisions so analysts can see what has been added, removed or modified.
d) Templates: Standardise recurring documents such as reports, meeting records and requirement specifications.
e) Collaborative Editing: Enable multiple authorised users to review and contribute to documents stored through supported cloud services.
Turn blank pages into brilliant documents with our comprehensive Microsoft Word Course – Sign up now!
5) MS PowerPoint
Microsoft PowerPoint helps analysts communicate recommendations, business cases, process changes and analysis results visually. It helps translate detailed analysis into concise presentations for stakeholders.
Key Features:
a) Visual Presentations: Organise findings into structured slides that make complex analysis easier for stakeholders to follow.
b) Charts and Diagrams: Present trends, comparisons, processes and relationships visually instead of relying only on text.
c) Templates and Layouts: Maintain a consistent structure and appearance across stakeholder presentations.
d) Multimedia Support: Add images, videos and other media when they improve the explanation of findings.
e) Collaboration: Allows team members to review and contribute to presentations before stakeholder meetings.
6) MS Visio
Microsoft Visio is a diagramming tool that Business Analysts can use to visualise business processes, workflows, systems and relationships. It supports flowcharts, process maps and other structured diagrams that make complex information easier to communicate and analyse.
Key Features:
a) Process Mapping: Create visual representations of existing and proposed business processes.
b) Flowcharts: Show activities, decisions and process paths in a structured sequence.
c) Business Diagrams: Represent organisational relationships, workflows and other business structures.
d) Data and System Models: Visualise relationships between systems, information and process components.
e) Reusable Shapes and Templates: Speed up diagram creation using predefined visual elements for common modelling needs.
7) Microsoft Power BI
Microsoft Power BI helps users transform business data into interactive reports, dashboards and visualisations. Business Analysts can connect information from different sources and present Key Performance Indicators (KPIs) and trends in an accessible format.
Key Features:
a) Interactive Reports: Turn business data into visual reports that users can filter and explore.
b) Dashboards: Bring important metrics and visualisations together to provide a high-level view of business performance.
c) Multiple Data Connections: Connect to different business data sources rather than analysing each source separately.
d) Data Visualisation: Represent information through charts, tables, KPIs and other visuals to make trends easier to understand.
e) Sharing and Collaboration: Distribute reports and dashboards and collaborate through Power BI workspaces and supported Microsoft services.
8) Lucidchart
Lucidchart is a visual diagramming platform that Business Analysts can use to represent business processes, workflows, systems and relationships. Its collaborative features make it particularly useful when analysts need to create diagrams and gather feedback from stakeholders.
Key Features:
a) Process Mapping: Create visual representations of business processes and operational workflows.
b) Flowcharts: Illustrate sequences, decisions and relationships within a process.
c) Diagram Templates: Use ready-made templates for different business and technical diagrams.
d) Real-time Collaboration: Allow stakeholders and team members to review and contribute to diagrams together.
e) Data Linking: Connect external data to diagrams to create more informative visual models.
Enhance your Requirements Engineering expertise with the BCS Practitioner Certificate in Requirements Engineering Training – Sign up soon!
9) Miro
Miro is a collaborative visual workspace that Business Analysts can use for workshops, brainstorming, process mapping and stakeholder discussions. Its flexible digital canvas is useful for bringing information together visually, particularly during discovery and requirements-gathering activities.
Key Features:
a) Digital Whiteboards: Create shared spaces where teams can develop and organise ideas visually.
b) Process Mapping: Map workflows, customer journeys and business processes.
c) Workshop Templates: Use structured templates for brainstorming, discovery and planning sessions.
d) Real-time Collaboration: Enable multiple stakeholders to contribute to the same board simultaneously.
e) Sticky Notes and Voting: Capture ideas and help teams prioritise requirements or potential solutions.
Pro Tip
Build your toolkit around activities, not brands. You may need one tool for requirements, another for modelling and another for data analysis.
10) Wrike
Wrike is a popular Business Analysis Tool widely used by Business Analysts. From initiating the project to reporting and analysing, this tool incorporates various features to make the process streamlined and efficient.
Key Features:
a) Task and Workflow Management: Organise work into tasks, projects and workflows so responsibilities are easier to monitor.
b) Multiple Work Views: Examine project information through formats such as boards, tables, calendars and Gantt-style views.
c) Workflow Automation: Automate repetitive actions and routing to reduce unnecessary manual administration.
d) Integrations: Connect Wrike with other workplace applications to create more connected workflows.
e) Document Collaboration: Keep files and project information associated with the work they support.
11) Monday.com
Monday.com is a powerful tool used primarily for collaboration and Project Management. It is a very flexible tool that can be used to manage the entire team and their work in one place.
Key Features:
a) Custom Workflows: Configure boards and processes around the way a particular team or project operates.
b) Workflow Automation: Automate selected repetitive actions, notifications and process steps.
c) Views and Dashboards: Present the same work in different ways and bring important project information into dashboards.
d) Integrations: Connect work management processes with other applications used across the organisation.
e) AI-assisted Workflows: Use supported AI capabilities within workflows to analyse, generate or route work where appropriate.
12) Balsamiq
Balsamiq is a wireframing tool that helps Business Analysts translate requirements and ideas into simple interface concepts. Low-fidelity wireframes can help stakeholders visualise proposed functionality before significant time and resources are invested in development.
Key Features:
a) Low-fidelity Wireframes: Create simple representations of websites, applications and interfaces.
b) Drag-and-drop Components: Build layouts using pre-designed interface elements.
c) Rapid Prototyping: Turn ideas and requirements into visual concepts quickly.
d) Reusable Components: Maintain consistency by reusing commonly required interface elements.
e) Stakeholder Review: Share wireframes to clarify expectations and gather feedback before development.
13) Azure DevOps
Azure DevOps provides tools for managing requirements, backlogs and development activities throughout a project. Business Analysts working with Agile or software teams can use it to document work items, monitor requirements and maintain visibility between business needs and delivery activities.
Key Features:
a) Work Items: Capture requirements, user stories, tasks, bugs and other project information.
b) Backlog Management: Organise and prioritise requirements according to project needs.
c) Boards: Visualise work through Kanban-style boards and monitor progress across stages.
d) Traceability: Connect requirements with related tasks, development activities and testing work.
e) Dashboards: Monitor project information, progress and key metrics through configurable views.
14) Draw.io
Draw.io, also known as diagrams.net, is a diagramming tool that Business Analysts can use to create process flows, system diagrams and other visual models. Its straightforward interface makes it useful for documenting processes and communicating relationships between different business or system components.
Key Features:
a) Flowcharts: Illustrate process sequences, decisions and business workflows.
b) Process Diagrams: Map existing and proposed processes to support analysis and improvement.
c) Diagram Libraries: Access shapes and components for business, technical and system diagrams.
d) Custom Layouts: Arrange and connect elements to represent complex relationships clearly.
e) Export Options: Save diagrams in different formats for use in reports, presentations and documentation.
Pro Tip
Review your Business Analysis toolkit periodically. Remove overlapping tools and reassess whether each one still supports the way your team works.
15) SAP Analytics Cloud
SAP Analytics Cloud is a cloud-based analytics platform that combines BI, planning and data visualisation capabilities. Business Analysts can use it to explore organisational data, build interactive dashboards and communicate insights that support business planning and decision-making.
Key Features:
a) Data Visualisation: Present complex business information through interactive charts and dashboards.
b) Business Intelligence: Analyse organisational data to uncover patterns, trends and performance insights.
c) Planning Tools: Support budgeting, forecasting and business planning within a shared environment.
d) Predictive Capabilities: Use analytical features to explore potential trends and outcomes.
e) Data Integration: Connect information from SAP and other data sources for broader analysis.
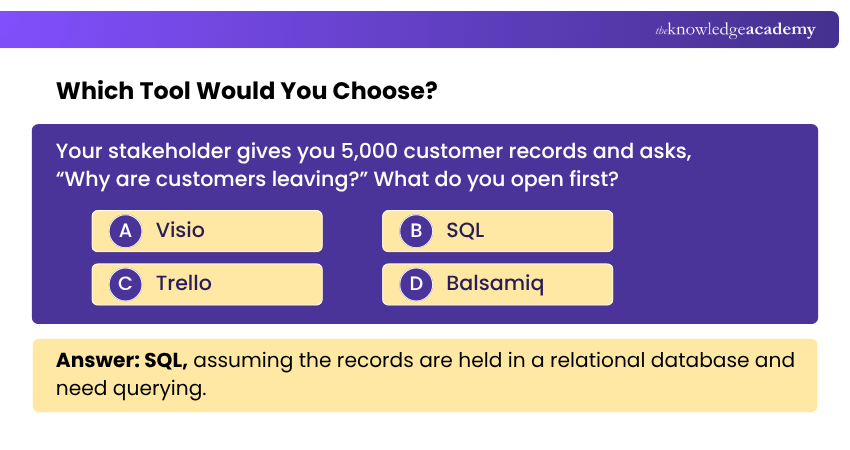
16) SQL
SQL is a query language widely used by Business Analysts who need to retrieve, filter and analyse information stored in Relational Database Management Systems (RDBMS).
Key Features:
a) Data Retrieval: Use queries to obtain specific records from relational databases instead of manually examining entire datasets.
b) Data Filtering: Apply conditions to narrow large datasets to the information relevant to a business question.
c) Data Aggregation: Calculate totals, averages, counts and other summaries that support analysis.
d) Table Joins: Combine related information from multiple database tables to build a more complete view of a business issue.
e) Data Manipulation: Insert, update and manage structured database information where appropriate permissions are available.
Pro Tip
Test the tool with a real Business Analysis task before committing. A short pilot can reveal usability, integration and workflow issues early.
Strengthen your analytical and problem-solving skills with the BCS Foundation Certificate in Business Analysis Training – Join now!
17) Tableau
This is a data visualisation and analytics software that helps in exploring, analysing, and sharing insights from your data.
Key Features:
a) Interactive Dashboards: Create visual dashboards that allow users to filter and drill into business information.
b) Multiple Data Connections: Connect to files, databases, data warehouses and other supported data sources.
c) Data Preparation: Shape, combine and prepare information before using it for analysis.
d) Visual Analytics: Explore patterns and trends using charts, maps, metrics and other interactive visualisations.
e) Sharing and Collaboration: Publish and share analytics through supported Tableau environments so stakeholders can explore findings.
18) Trello
Trello is a visual work management tool that helps Business Analysts organise tasks, track activities and coordinate work across teams. Its board-based structure makes it easy to see the status of requirements, actions and project activities as they move through different stages.
Key Features:
a) Kanban Boards: Organise work visually according to different stages or workflows.
b) Cards and Lists: Break activities into manageable items and organise them by status or priority.
c) Task Assignment: Assign responsibilities to team members and improve accountability.
d) Labels and Checklists: Categorise work and track smaller actions within individual tasks.
e) Automation: Automate repetitive actions and workflow updates using built-in rules.
19) Jira
Jira is a strong fit because Business Analysts can use it to document and track requirements, manage related work items and monitor progress.
Key Features:
a) Requirements Tracking: Create work items for requirements and add descriptions, priorities, acceptance criteria and other relevant information.
b) Traceability: Link requirements to related tasks, user stories and test cases to understand dependencies and track their progress.
c) Custom Workflows: Configure workflows to reflect how requirements or other work move through different stages.
d) Multiple Views: Use boards, lists, timelines and calendars to view and monitor work from different perspectives.
e) Dashboards and Reporting: Build dashboards and reports to monitor requirement status, dependencies, progress and other project measures.
20) IBM DOORS Next
IBM Engineering Requirements Management DOORS Next is a requirements management platform that helps Business Analysts capture, organise, trace and manage requirements throughout complex projects. It is particularly useful when multiple stakeholders, dependencies and requirement changes need to be controlled in one central environment.
Key Features:
Requirements Capture: Record and organise business, stakeholder and system requirements in a structured format.
Traceability: Link requirements to related processes, designs, test cases and other project elements.
Change Management: Track updates to requirements and understand how changes may affect connected work.
Collaboration: Allow stakeholders and team members to review, comment on and validate requirements.
Reporting and Views: Create customised views and reports to monitor requirement status, relationships and progress.
Before choosing a Business Analysis Tool, check:
☐ Purpose: Does it support the specific Business Analysis task you need to perform?☐ Ease of Use: Can analysts & stakeholders use it without unnecessary complexity?☐ Integration: Does it connect with your existing systems and data sources?☐ Collaboration: Can stakeholders easily review, share and contribute to the work?☐ Data Handling: Can it manage the type and volume of data you work with?☐ Security: Does it provide suitable access controls and data protection features?☐ Scalability: Can it support larger teams or datasets as needs grow?☐ Reporting: Can it turn findings into clear reports, dashboards or visualisations?☐ Cost: Do licensing, training and implementation costs fit your budget?☐ Support: Are sufficient documentation, training and technical support available?☐ Trial or Pilot: Can you test it with a real Business Analysis task before committing?
Conclusion
The right Business Analysis Tools can make it easier to organise requirements, analyse information, visualise processes and communicate with stakeholders. However, there is no single tool that suits every Business Analysis activity. Start with the problem you need to solve, identify the appropriate tool category and choose software that fits your workflow, users and business needs.
Be the link between business vision and successful execution with Business Analysis Courses - Sign up now!
Frequently Asked Questions
Do Business Analysts Need to Know SQL?

Not every Business Analyst role requires SQL. However, it can be useful when the role involves retrieving or analysing information stored in relational databases. The level of SQL knowledge required depends on the organisation and the responsibilities of the role.
Can Excel Still be Useful for Business Analysis?
Yes. Excel can support calculations, data organisation, filtering, charts and smaller-scale analysis. More specialised BI or database tools may be appropriate when data volumes or reporting requirements become more complex.
Can Business Analysts Use More than One Tool?
Yes. Business Analysts often perform several different activities, so a combination of tools may be more practical than relying on one platform. For example, one tool may support process modelling while another is used for data visualisation or documentation.
Are Business Analysis Tools Only Used for Data Analysis?
No, Business Analysis tools support much more than data analysis. They can help with requirements management, process modelling, stakeholder collaboration, documentation, workflow tracking and reporting, enabling Business Analysts to understand needs, identify improvements and support informed business decisions.

The Knowledge Academy


Global Training Provider
The Knowledge Academy is a world-leading provider of professional training courses, offering globally recognised qualifications across a wide range of subjects. With expert trainers, up-to-date course material, and flexible learning options, we aim to empower professionals and organisations to achieve their goals through continuous learning.


 If you wish to make any changes to your course, please


