We may not have the course you’re looking for. If you enquire or give us a call on 01344203999 and speak to our training experts, we may still be able to help with your training requirements.
Training Outcomes Within Your Budget!
We ensure quality, budget-alignment, and timely delivery by our expert instructors.

Microsoft Excel is one of the most widely used software programmes worldwide. Excel has powerful tools and functions used in international IT companies' applications. It makes data entry, reading, and processing simple. Excel keeps the information in a table format in Rows and Columns.
Excel is the industry standard for financial modelling and analysis in all organisations. According to a survey conducted by Statista, more than 86% of survey respondents reported using Excel products for work-related daily tasks. MS Excel is used by everyone, including receptionists, accountants, data engineers, and human resource professionals, to do jobs with Excel skills quickly and effectively.
In this blog, we'll discuss what is Excel, its key features, benefits, and other essential uses.
Table of Contents
1) What is Excel? Excel Definition
2) History of MS Excel and Its Evolution
3) Microsoft Excel Overview
4) Key Features of Microsoft Excel – Terminologies and Components
5) Benefits of Using MS Excel
6) Common Excel Use Cases
7) Advanced MS Excel Capabilities
8) Excel Competitors
9) MS Excel: Essential Formulas and Functions
10) Conclusion
What is Excel? Excel Definition
Microsoft's Excel spreadsheet programme is a part of the Office family of business software programmes. Users of Microsoft Excel can format, arrange, and compute data in a spreadsheet.
By organising data using tools like Excel, Data Analysts or other users can make information easier to examine when data is added or altered. The Microsoft Office and Office 365 suites include Excel, which works with the other Office programmes. The spreadsheet application can be used on Windows, macOS, Android, and iOS devices.
History of MS Excel and its Evolution

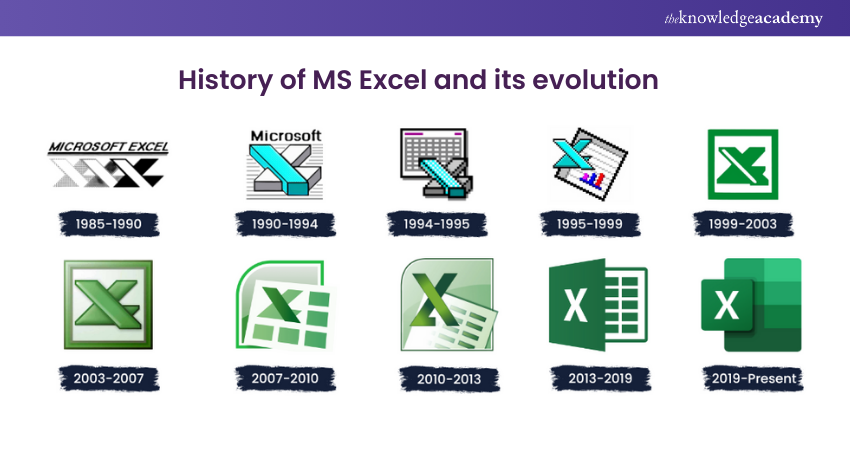
Microsoft Excel was introduced in 1985 as Microsoft Multiplan. It allowed the users to point and click using a graphical user interface. Compared to its competitors, such as Lotus 1-2-3, it also made it easier to alter, process and view spreadsheet data.
However, due to already available spreadsheet programmes, Microsoft Excel/Multiplan could did not gain much popularity on Microsoft Disk Operating System (MS-DOS). Thus, in 1987 Microsoft came up with version 2 of Excel, which outperformed its competitors in the market.
Further, it continued to evolve with version 3 in 1990 with features such as toolbars, 3D charts, drawing options and outlining capabilities. With version 4 and version 5, Excel caught people’s eyes as many new features were added.
Microsoft took a big leap in 2007 when it introduced a new ribbon menu system to Excel. Also, improved functions such as SmartArt set of diagrams, better management of named variables and more flexible graph formatting came into use.
Power View, Power Pivot and Flash Fill, and improved multithreading were introduced with version 15 in 2013. Version 16 is Excel’s most recent version, released in 2019, with which it has become one of the most widely used spreadsheet programmes across various sectors. It remains unbeatable with each new update.
Microsoft Excel Overview
Here is Microsoft Excel Basics overview which refer to the fundamental features and functionalities of it-

1) How to open MS Excel?
The steps listed below should help you open Microsoft Excel on your computer:
a) Select "Start"
b) Then All Programs
c) The next step is to select MS Office
d) Finally, choose MS Excel as your option
e) Alternatively, you can select the Start button and type MS Excel into the available search box
2) What is a cell?
A spreadsheet looks like a table with rows and columns. A cell is a rectangular box created by the point where rows and columns converge. The most minor but valuable component of Excel is the cell. Your data (numbers or text) can be typed, copied, and pasted into the cell. A cell's boundaries, size, text colour, background colour, and other properties are all customisable.
3) What is a Cell Address?
The term by which a cell can be addressed is known as the cell address. A cell's address, which involves its column number and row number, serves as an important identifier for each cell.
4) What is Worksheet?
A worksheet includes several cells. Additionally, it has an unseen draw layer that stores diagrams, charts, and photos. Extra worksheets are accessible from the window's bottom.
5) What is Workbook?
In Microsoft Excel, a workbook is a separate file. There are one or more worksheets inside each workbook. As a result, a workbook is frequently referred to as a worksheet or a group of worksheets. You can change the order of your worksheets, add, or remove worksheets, hide worksheets without deleting them from the workbook, and much more.
Key features of Microsoft Excel – terminologies and components
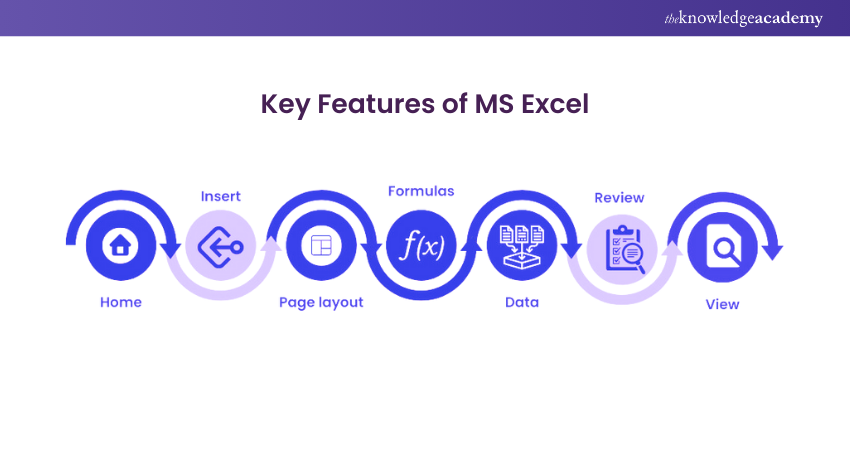
On an Excel spreadsheet, different editing and formatting options are available. The key features of MS Excel are discussed below.

1) Home- Font size, font style, colour, background colour, alignment, formatting options and styles, cell insertion and deletion, and editing options are all included under the title "Home."
2) Insert- This feature includes choices for creating graphs, sparklines and different types of chart in Excel, entering images and figures, changing the header and footer, and adding equations and symbols to tables.
3) Page layout- This includes options for themes, orientation, and page setup.
4) Formulas- Since MS Excel allows you to create tables with a lot of data, you may use this function to add formulas to your table and obtain quicker results.
5) Data- This category includes tools for adding external data (from the web), filtering choices, and data tools.
6) Review- A reader can submit comments after proofreading an Excel sheet (similar to spell-checking) in the review area.
7) View- Views can be altered, and we can choose which ones we wish to use to display the spreadsheet. This area provides options for pane arrangement and zooming in and out.
Build your career as a Data Analyst and learn to prepare tables. Charts, sheets, and reports with our Data Analysis Training using MS Excel!
Benefits of using MS Excel
MS Excel is extensively used for several reasons since it simplifies storing data, along with adding and removing information with no effort. The following are a few significant benefits of using Microsoft Excel:
1) Accessible To store data: MS Excel saves and analyses data with no limit on the quantity of data that can be recorded in a spreadsheet. In Excel, information filtering is simple and practical.
2) Easy To recover data: Finding the information may take longer if written on paper, but this is not the case with Excel spreadsheets. It is simple to locate and retrieve data.
3) Application of mathematical formulas: On an Excel spreadsheet it is simple and easy to perform calculations using MS Excel's formula.
4) More secure: Compared to data recorded in registers or pieces of paper, these spreadsheets have a much lower chance of being lost and can be password-protected on a laptop or desktop computer.
5) Data at one place: Previously, once the paperwork was completed, data had to be retained in various files and registers. This has become convenient now that multiple worksheets may be added to a single MS Excel file.
6) Neater and clearer visibility of information: Analysing data is simpler when saved as a table. As a result, information is more comprehensible and readable.
Today, companies, businesses, schools, financial firms, government bodies, and almost every sector that uses technology highly depend upon MS Excel, thus underwriting the importance of Excel Skills for Business. They use Excel to store, change, modify, recover, analyse and compute data. Thus, providing numerous benefits to its users.
Common Excel use cases
Almost every industry makes use of Microsoft Excel. So, let’s have a look at a few examples of how organisations use this tool across domains:

Uses of MS Excel in real time domains
Today, Excel is used widely across sectors to perform various tasks and ease data collection, processing, analysing, computation, and presenting data. Here is the list of a few real-time Excel-using domains:
1) To perform calculations of all kinds. Excel is frequently used in the financial sector.
2) Excel is a tool that analytical professionals use daily to apply fundamental analytical techniques and tools.
3) The banking industry uses it for customer understanding their customers.
4) Retail Associates uses POS data analysis to examine changes and trends in sales.
5) Reporting Analysts use it to create of daily, weekly, monthly, quarterly, and annual reports.
6) Utilised by healthcare teams to analyse longitudinal data.
7) Market research analysts employ it for determining the frequencies and cumulative aggregates.
8) Office applications, tools, add-ins, and dashboards are all created using VBA.
Want to learn how to create advanced formulas and macros in MS Excel? Sign up for Microsoft Excel Expert!
Uses of MS Excel in organisations
Various organisations use Excel to perform multi-layered tasks all at once. Its use makes it easier for companies to regulate overall work efficiency. Therefore, it is essential to understand its various benefits in organisations. Here is a list of reasons why Excel is used in organisations:
1) For collecting and verifying business data: It Ensures that data is collected in a systematic and organised manner. Thus, it becomes easy to verify large amounts of data.
2) For business analysis: Business analysts compute and analyse data using Excel's various formulas and functions.
3) For data entry and storage: Data entry and storage become easy by using charts, graphs and tables to accommodate and manage large entries.
4) For data analysis: Pivot tables provide a deep understanding of data entered in an Excel spreadsheet.
5) For performance reporting: Using strings, dates and numerical functions in Excel, organisations can keep track of employee's working hours, number of leaves, overtime, and other data. Thus, they can further prepare graphs of their performances using Excel.
6) For strategic analysis: Data analysts use Excel to develop tools and dashboards, which helps divide data across spreadsheets. Therefore, organisations can systematically analyse data.
7) For accounting and budgeting: Whether you are a business (large or small), school, financial firm, law firm or public sector domain, Excel makes it easier to account for and budget various financial requirements of the organisations using in-built formulas.
9) For account management: Organisations can use it to manage large accounts relating to human resource, finance, multiple projects, etc.
10) For project management: Pricing, budgeting, computing, distribution of work and reporting become easy while handling numerous projects in one go.
11) For Office Administration: Companies use Excel for various tasks such as maintaining employee reports, reporting projects in hand, entering due dates, etc.
Advanced MS Excel capabilities
MS Excel not only stores but also computes and recovers data; it has some advanced features. So, let's have a look at some of them:
1) TREND function: It is a tool that calculates linear trend lines through a set of Y or X values. Industries use this feature for time series trend analysis or projecting future funds.
2) MIN and MAX Functions: The MIN and MAX functions allow users to select minimum and maximum values from data sets.
3) VLOOKUP: The VLOOKUP or Vertical Lookup function is used to search values in a larger data set and extract data into a new table.
4) Table Array: Two or more tables with data and values linked and related to each other makes a Table Array. It is a part of VLOOKUP.
5) Col_index_num: It is a function in table array that defines the column from where data is being extracted.
6) Range_lookup: Range lookup is a value in VLOOKUP that provides information nearest to what a user is looking to when there is no match available.
7) AND function: This function includes more than one criterion when searching for variables. The input for this function is =AND.
Excel Alternative Or Competitors
Although MS Excel is the best spreadsheet programme, other platforms also provide similar services, resulting in increased competition in the market. Some of them are:

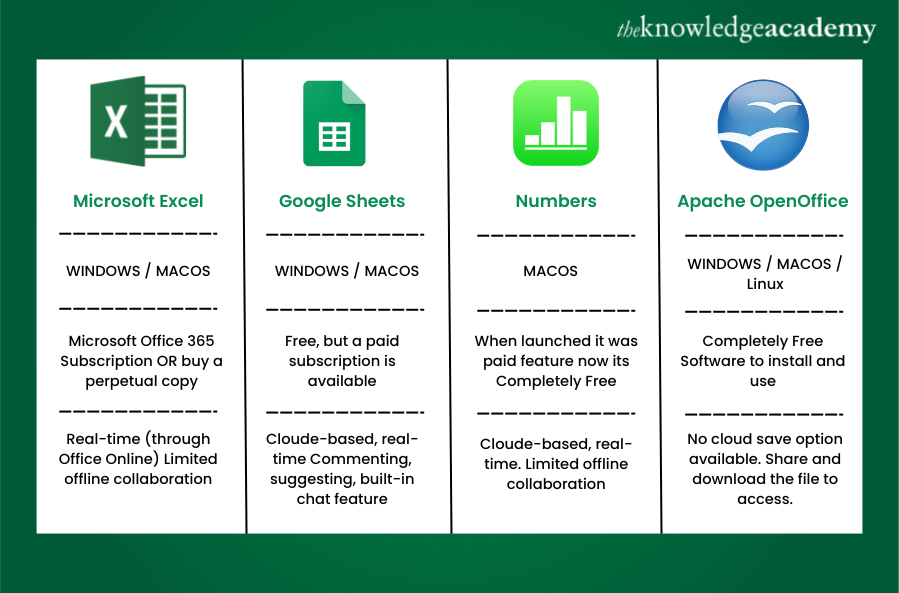
Google Sheets
Google Sheets is a strong competitor of Excel. It has similar layouts and features. Multiple users can access Google sheets and can work together from numerous devices.
Numbers
It is an Apple Spreadsheet program. It is available free to users around the world. Numbers cannot handle huge data sets while it has the best graphics and charts. Also, it is only available for Apple’s devices.
Apache OpenOffice Calc.
It is a free, open-source spreadsheet software with multiple features such as natural language formulas, Data Pilot, style and formatting, and multiple-user collaboration. It is available for Windows as well as macOS platforms.
MS Excel: Essential Formulas and Functions
Microsoft Excel formulas and functions ease the storage, manipulation, and recovery of data. To work hassle-free using Excel, it is important to know about its functions and formulas. So, let's have a look at them:
Functions of MS Excel
Some of the functions of MS Excel are:
1) NOT: Creates Reverse of a given logic. For example, !k = 15 means k = 15
2) IF: IF in an Excel spreadsheet determines a logical expression and returns its value for both Boolean results. The values are returned using two logical expressions TRUE or FALSE.
3) OR: Useful to check if any of the conditions is True. It returns the value as True if any expressions passed as its arguments are true. It will return FALSE if all the values are False.
4) Search: This function searches for a sub-string string and returns its position as a number.
5) IFERROR: IFERROR is a Logical function in MS Excel that checks the values for Error.
6) Arguments: They are the input values for Excel functions. It means that Excel functions use one or more arguments that will be used in the function programs as input data.
7) Logical Functions: This function of Excel helps to check if an expression is True or False based on logic.
8) FIND: The FIND function returns the position as a number of the given string inside the other string.
Formulas in MS Excel:
Following are the basic Excel formulas used in Excel to perform various calculations and analyse data:
1) SUM – the SUM formula is used to add values of the selected cells.
2) COUNT – to get the number of entries in a range or numbers, use COUNT.
3) AVG – an AVG formula gets the average of the arguments selected. For example, if the range C1:C20 contains numbers, the average of these values will be calculated as =AVERAGE (C1:C20)
4) COUNTA – to count cells containing any information such as error values and empty texts COUNTA is used.
5) LEN – it counts the characters present from the selected cells.
6) TRIM – using TRIM users can remove spaces from the text except for single spaces between words.
7) NOW – to display current date and time or calculate value based on current time and date use NOW and you also change the date format.
8) ROUND – to round up the values of a cell use ROUND.
9) CHOOSE – it returns a value from the list of specified positions or index numbers.
10) SUMIF and COUNTIF – COUNTIF applies criteria across multiple cell ranges and counts the number of cells that meet the criteria. Whereas SUMIF adds all of its arguments that meet the criteria.
11) CELL, LEFT, RIGHT and MID – CELL calculates cells if they contain numeric values and returns zero if the cells contain text or is blank. LEFT returns the first character in a text string. RIGHT returns the last character and MID returns a specific number from a text string based on the characters specified by the user
12) XLOOKUP – it searches for a range and then returns the item relative to the first match it finds.

Conclusion
We hope you have got a clear picture of what is Excel and how you can use it to make your tasks a ton easier. After reading this blog, you should have a clear understanding of how to use Excel, it’s features and how Microsoft Excel has evolved to be the most widely used tool worldwide.
Learning Excel will advance your career in any industry, so to know in detail about Excel, sign up for our Microsoft Excel Training courses today!
Frequently Asked Questions
Upcoming Office Applications Resources Batches & Dates
Date
 Microsoft Excel Course
Mon 5th Aug 2024
Mon 19th Aug 2024
Mon 2nd Sep 2024
Mon 16th Sep 2024
Mon 7th Oct 2024
Mon 21st Oct 2024
Mon 4th Nov 2024
Mon 18th Nov 2024
Mon 2nd Dec 2024
Mon 9th Dec 2024
Mon 16th Dec 2024
Mon 13th Jan 2025
Mon 3rd Feb 2025
Mon 10th Mar 2025
Mon 7th Apr 2025
Mon 19th May 2025
Mon 9th Jun 2025
Mon 14th Jul 2025
Mon 4th Aug 2025
Mon 8th Sep 2025
Mon 6th Oct 2025
Mon 10th Nov 2025
Mon 1st Dec 2025


 Top Rated Course


 If you wish to make any changes to your course, please


