


We may not have the course you’re looking for. If you enquire or give us a call on 01344203999 and speak to our training experts, we may still be able to help with your training requirements.
Business Process Modelling Techniques: 12 Methods Explained
ByThe Knowledge AcademyLast updated on: 16 November 2026
Explore 12 business process modelling techniques, including BPMN, flowcharts, UML Activity Diagrams and Petri Nets. Understand their different uses, from mapping workflows to analysing complex processes, and learn how to choose a method for your organisation.

At a Glance
1. Business process modelling represents workflows to improve understanding and analysis.2. BPMN provides a common notation for documenting business processes.3. Flowcharts help visualise activities, decisions and process sequences.4. RADs highlight responsibilities, while Petri Nets support the analysis of complex process behaviour.5. The right approach depends on process complexity, modelling objectives and stakeholder needs.
Are inefficient workflows slowing down your business? Are tasks getting delayed while teams struggle to communicate clearly? These are signs that your business processes may need reviewing. Business process modelling techniques help visualise workflows, identify inefficiencies and highlight opportunities to improve operations.
However, understanding a process fully often requires looking at it from different perspectives. Some methods focus on activities, while others reveal how information moves or how different roles interact. In this blog, we'll explore 12 techniques and their practical applications to help you understand these differences.
12 Business Process Modelling Techniques
Business process modelling techniques provide different ways to document, analyse and identify opportunities to improve organisational workflows. Let's explore 12 techniques and understand where each one works best:
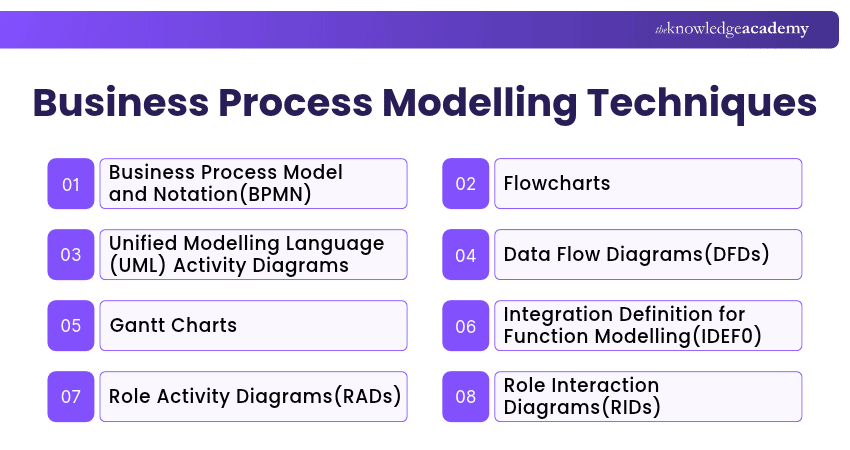
1) Business Process Model and Notation (BPMN)
Business Process Model and Notation (BPMN) is a standard graphical notation used to represent business processes. It provides a structured way to illustrate activities, events, decisions and interactions between participants. BPMN uses symbols such as events, tasks, gateways and connecting flows to explain how a process operates.
It can also represent different responsibilities through pools and lanes, making it particularly useful for processes involving multiple teams or organisations. For example, an online order process can be represented using BPMN to show how an order is received, payment is verified, stock is checked and delivery is arranged.

2) Flowcharts
Flowcharts are among the simplest and most widely recognised business process modelling techniques. They use standard shapes, symbols and arrows to illustrate the sequence of activities and decisions involved in a process. Rectangles generally represent activities, diamonds indicate decision points, and arrows show the direction of the workflow.
This straightforward structure makes flowcharts easy to create and understand. For example, a customer refund process can be represented through a flowchart showing the request, eligibility check, approval decision and refund processing. Each decision leads to the next appropriate action.
3) Unified Modelling Language (UML) Activity Diagrams
Unified Modelling Language (UML) is a standard modelling language commonly used in software and systems development. Among its different diagram types, UML activity diagrams are particularly relevant to business process modelling. Activity diagrams represent the sequence of actions, decision points and control flows within a process.
They can also show parallel activities and responsibilities, helping teams understand how tasks progress from one stage to another. For example, a customer registration process may involve entering personal details, validating information, creating an account and sending a confirmation message.
4) Data Flow Diagrams (DFDs)
Data Flow Diagrams (DFDs) illustrate how information moves through a system or business process. They focus on the sources, destinations, processing activities and storage of data rather than the chronological order of tasks. DFDs use symbols to represent processes, data stores, external entities and data flows.
This helps organisations understand where information originates, how it is transformed and where it is stored or transferred. For example, in an online banking system, a DFD can illustrate how transaction information moves between customers, banking applications, account databases and payment-processing systems.
5) Gantt Charts
Gantt charts are visual scheduling tools that display activities against a timeline. Although primarily used in project management, they can complement business process models by showing when activities are scheduled and how long they are expected to take.
A Gantt chart uses horizontal bars to represent the planned start dates, finish dates and durations of tasks.
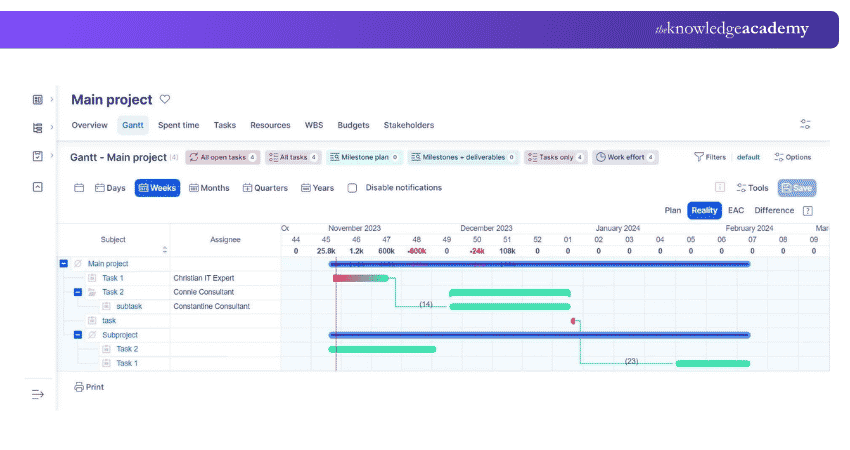
Depending on the software used, it may also display dependencies, progress and assigned resources. For example, a software development project can use a Gantt chart to show when requirements analysis, development, testing and deployment activities are scheduled.
6) Integration Definition for Function Modelling (IDEF0)
Integration Definition for Function Modelling (IDEF0) is a method for representing business functions and their relationships. It uses inputs, controls, outputs and mechanisms to show how activities operate, making it useful for analysing organisational processes.
For example, a purchase order approval process may involve a purchase request as an input, purchasing policies as controls, an approved order as an output and the purchasing team as a mechanism.
7) Role Activity Diagrams (RADs)
Role activity diagrams represent business processes from the perspective of the roles responsible for performing activities. They show how different participants carry out tasks and interact to achieve a shared objective. Unlike techniques that primarily focus on activity sequences, RADs emphasise role behaviour, responsibilities and coordination.
For example, a purchase approval process may involve an employee submitting a request, a manager reviewing it and a finance team checking budget availability. A RAD can represent the activities performed by each role and the interactions between them.
Pro Tip
Pay close attention to where work passes from one department to another. A process may appear efficient when individual tasks are examined, but delays often occur between responsibilities. Mapping these handovers can help identify unclear ownership and opportunities to improve coordination.
8) Role Interaction Diagrams (RIDs)
Role Interaction Diagrams (RIDs) focus on activities and interactions between roles in a business process. They illustrate how requests, information and responses are exchanged, making coordination points easier to examine.
These diagrams are useful when the success of a process depends heavily on communication and collaboration between individuals or departments.
For example, a customer complaint resolution process may involve a Customer Service Representative, Technical Support Specialist and Service Manager. A role interaction diagram can show when information is exchanged, how issues are escalated and which participants are involved.
Learn to create process maps that simplify operations with the Business Process Mapping Training – Sign up now!
9) Functional Flow Block Diagrams (FFBDs)
Functional Flow Block Diagrams (FFBDs) provide a structured representation of the functional sequence involved in a system or process. They show the order in which functions must occur and can represent branching or parallel functional paths.
FFBDs are commonly used in systems engineering, where understanding functional dependencies is essential for designing and analysing complex systems.
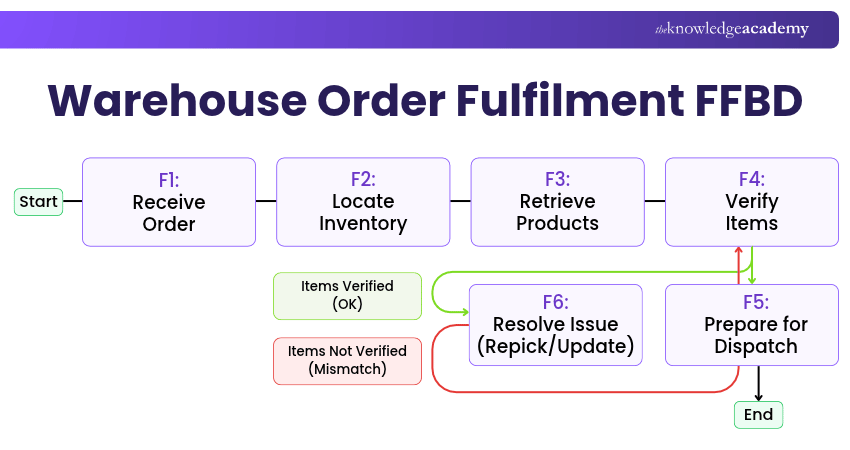
For example, an automated warehouse system may involve receiving an order, locating inventory, retrieving products, verifying items and preparing them for dispatch. An FFBD can represent the functional relationships between these activities.
10) Petri Nets
Petri nets are a graphical and mathematical modelling technique used to represent processes involving concurrent activities, synchronisation and shared resources. They consist of places, transitions and directed connections. Places represent conditions or states, transitions represent events or actions, and tokens indicate the current state of the model.
For example, a manufacturing process may require both materials and an available machine before production can begin. A Petri net can represent these conditions and show how the process changes once the required resources become available.
11) Coloured Petri Nets (CPNs)
Coloured Petri Nets (CPNs) extend traditional Petri nets by allowing tokens to carry typed information, such as values, categories or attributes. In a basic Petri net, tokens generally represent the presence or quantity of something. In a Coloured Petri net, tokens can contain information that helps distinguish different items moving through the same process.
For example, a logistics system may process standard, express and international orders through shared activities. CPNs can represent the different order categories and apply conditions based on their attributes. This technique is particularly useful when modelling complex systems involving multiple types of information or interacting workflows.
12) Object-Oriented Methods
Object-Oriented methods represent systems using objects that combine information and behaviour. These methods are primarily associated with software and systems modelling but can also support the analysis of business processes. In a business context, objects may represent customers, orders, invoices or other entities involved in organisational activities.
Their attributes and interactions help describe how the system supports particular business functions. For example, an order management system may contain Customer, Order, Product and Payment objects. By modelling how these objects interact when an order is placed, paid for and fulfilled, organisations can examine how the system supports each stage of the process.
How to Choose the Right Business Process Modelling Technique?
Choosing the right business process modelling technique depends on what you want to understand, the complexity of your workflow and the level of detail required. Consider the following factors:
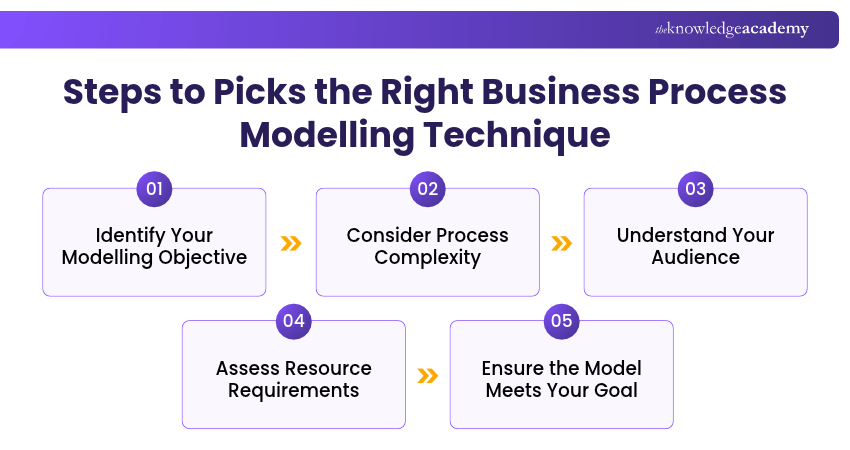
1) Identify Your Modelling Objective
Start by determining what you want to achieve. Are you documenting a workflow, analysing information movement, clarifying responsibilities or studying process behaviour? The answer will help narrow down the most appropriate techniques.
2) Consider Process Complexity
Simple workflows may only require a flowchart, while more detailed cross-functional processes may benefit from BPMN. Complex system behaviour involving concurrency may require Petri nets or similar formal methods.
3) Understand Your Audience
Consider who will use the model. A diagram intended for employees and business stakeholders should be easy to interpret, while technical teams may require additional detail and precision.
4) Evaluate Information and Resource Requirements
Some techniques are straightforward to create, while others require specialised tools, technical knowledge or additional modelling effort. Select an approach that provides sufficient detail without introducing unnecessary complexity.
5) Check Whether the Model Supports Your Goal
Test the model against a real process scenario to check whether it accurately represents the activities, relationships or behaviours you need to examine. Where necessary, use complementary techniques to represent different aspects of the same process.
Business Process Modelling Checklist
Before finalising a business process model, review the following questions to ensure the relevant elements are covered. Adapt them to suit your chosen technique.
□ Have you clearly defined where the process starts and ends?□ Have you identified the main activities and decisions?□ Have you included the relevant participants and responsibilities?□ Have you captured important information inputs and outputs?□ Have you represented dependencies and necessary interactions?□ Have you checked the model with people who perform the process?□ Have you identified areas that require further analysis or improvement?
Learn how to develop a continuous improvement plan and schedule with our Business Process Improvement Training – Join now!

The Knowledge Academy develops accessible learning content across Project Management, IT, Cybersecurity, Data Science, Business Analysis, HR, Accounting and Finance, Leadership and Health and Safety. Its resources combine subject research with clear explanations to help professionals build practical knowledge across a wide range of disciplines.
View Detail

 If you wish to make any changes to your course, please


