Who Should Attend this R Programming Course?
Our R Programming Course is suitable for professionals seeking to develop their knowledge of R for data analysis, statistical computing and visualisation. The following professionals can benefit from this course:
- Data Analysts
- Data Scientists
- Statistical Analysts
- Business Intelligence Analysts
- Research Analysts
- Financial Analysts
- Bioinformatics Analysts
Prerequisites for the R Programming Course
There are no formal prerequisites for attending this R Programming Course. However, basic computer literacy and a general understanding of programming concepts can be beneficial.
R Programming Course Overview
The R Programming Course introduces delegates to the R programming language for data analysis and statistical computing. It covers R syntax, data types, variables, operators, control flow, functions, and core data structures such as vectors, lists, matrices, and arrays.
Delegates will develop skills in data handling, data frames, importing and exporting data, data cleaning, and statistical analysis. This R Programming Training also covers linear, logistic, and multiple regression, normal and binomial distributions, and data visualisation using bar charts, histograms, and scatter plots.
This 1-Day course by The Knowledge Academy enables delegates to apply R to data analysis tasks with greater confidence. They will be able to organise and manipulate data, perform statistical analysis, interpret regression outputs, and create clear visualisations.
R Programming Course Objectives
- To understand R syntax, variables, operators, and core data structures
- To apply decision-making statements and loops for programming tasks
- To create and work with functions, vectors, lists, matrices, and arrays
- To import, export, clean, reshape, and manipulate data using R
- To perform linear, logistic, and multiple regression analysis
- To create bar charts, histograms, and scatter plots for data visualisation
Learning Outcome of this R Programming Course
Upon completing this R Programming Course, delegates will be able to use R syntax, data structures and functions to perform data analysis tasks. They will develop the ability to clean and manipulate datasets, apply statistical techniques, create data visualisations and interpret results to support informed decision-making.
Reasons to Learn R Programming
R Programming is a valuable language for working with data, performing statistical analysis, and creating clear visual insights. Some of the key reasons to choose our R Programming Course are:
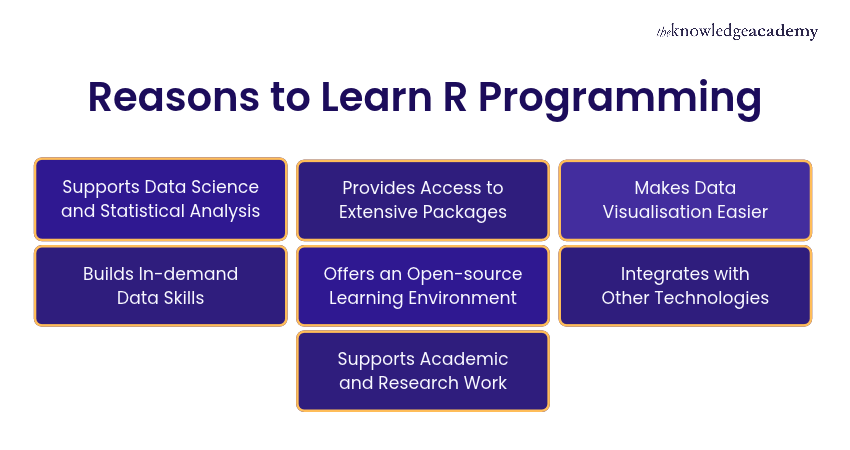
- Supports Data Science and Statistical Analysis: R helps users analyse datasets, apply statistical methods, and build predictive models for solving data-related problems.
- Provides Access to Extensive Packages: R offers many packages for data manipulation, machine learning, reporting, and visualisation, making analytical tasks easier.
- Makes Data Visualisation Easier: R supports clear charts, graphs, and reports that help present data insights in a simple visual format.
- Builds In-demand Data Skills: Learning R helps develop analytical skills required for data analysis, business intelligence, research, and decision-making roles.
- Offers an Open-source Learning Environment: R is free to use and supported by a strong community, making it accessible for both individuals and organisations.
- Integrates with Other Technologies: R works with tools such as Python, SQL, and big data platforms, supporting flexible data workflows.
- Supports Academic and Research Work: R is widely used in research and education for statistical analysis, modelling, and data interpretation across many fields.
Skills You'll Gain from this R Programming Course
Our R Programming Course helps delegates develop practical skills for programming, data handling, statistical analysis, and visualisation using R. Key skills include:
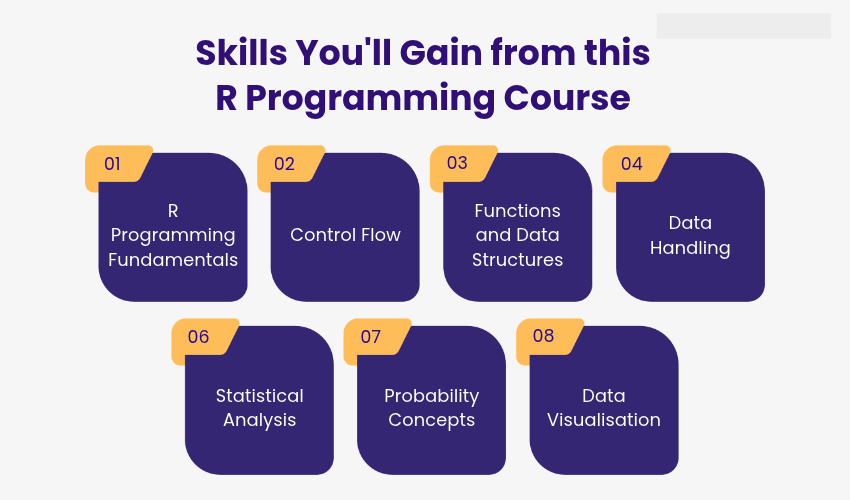
- R Programming Fundamentals: Work with syntax, variables, operators, and basic commands
- Control Flow: Apply conditions and loops to manage program logic
- Functions and Data Structures: Use functions, vectors, lists, matrices, arrays, and data frames
- Data Handling: Import, export, clean, reshape, and manage data effectively
- Statistical Analysis: Perform linear, logistic, and multiple regression analysis
- Probability Concepts: Work with normal and binomial distributions
- Data Visualisation: Create bar charts, histograms, and scatter plots to present data clearly





 If you miss out, enquire to get yourself on the waiting list for the next day!


 If you wish to make any changes to your course, please


