

 Top Rated Course

We may not have the course you’re looking for. If you enquire or give us a call on 01344203999 and speak to our training experts, we may still be able to help with your training requirements.
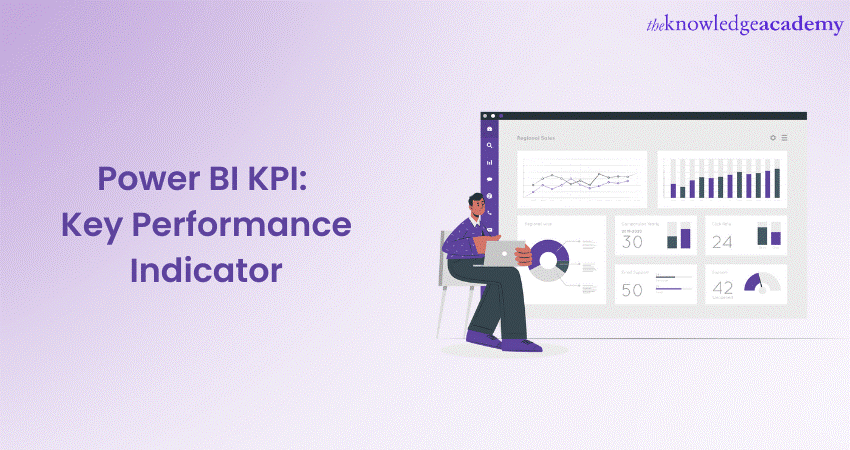
Power BI KPI: Key Performance Indicator
The Knowledge Academy 07 April 2026Do you wish to understand what KPIs are but need help figuring out where to start? This blog on Power BI KPI will help you understand the Key Performance Indicators in the Power BI tool while also explaining its core elements, such as base value. Additionally, it will take you through its uses, such as tracking progress and measuring the target distance.

Training Outcomes Within Your Budget!
We ensure quality, budget-alignment, and timely delivery by our expert instructors.
Table of Contents
Did you know Power BI KPIs are like your personal fitness tracker for your business, helping you measure and monitor the Key Performance Indicators that matter the most? With Power BI Key Performance Indicators (KPI), you can easily monitor your business's progress by visualising important metrics efficiently and interactively.
According toStatista, the Business Intelligence (BI) tools market will reach a valuation of 12.18 billion GBP in the coming years. Whether you're tracking sales, customer satisfaction, or any other important aspect of your organisation, Power BI KPIs provide clear insights at a glance, empowering you to make informed decisions with appropriate actions. KPIs are essential for data analysis and visualisation. Learn how to use Power BI KPIs to measure performance.
Table of Contents
1) >Understanding KPIs
2) Core elements of KPI in Power BI
3) Key features of KPI
4) Uses of KPIs
5) Requirements for KPI
6) Steps to create a KPI in Power BI Desktop
7) Power BI KPI prerequisites
8) Considerations and troubleshooting
9) Power BI KPI dashboards: Examples
10) Conclusion
Understanding KPIs
KPIs are valuable tools for businesses to assess performance in various areas using measurable values. They provide visual indicators of growth and progress by comparing actual results to predetermined targets. By observing KPIs, you can quickly analyse performance and identify areas for improvement. These quantifiable measures act as a reference point, helping organisations track their success and make informed decisions.
Each KPI has a baseline value compared against a target value, allowing for a comparison between current performance and desired outcomes. KPIs act as guideposts, helping businesses understand how well they are performing and if any adjustments or improvements are needed. Preparing for interviews by going through Power BI Interview Questions and Answers can assist in learning the importance of KPIs in business intelligence.

Core elements of KPI in Power BI
In Power BI, KPIs consist of three essential elements:
a) Base value: In Power BI, the base value denotes the metric's beginning point or current performance level. It acts as a baseline for comparison with the goal value. Typically, the base value is a measurement or calculated number that is derived from your data.
b) Target value: The target value is the specific number or goal you want to reach for a particular metric. It serves as a guide for measuring your progress. The target value can be a set number that remains the same over time or be dynamically calculated based on specific criteria. It serves as a clear objective to work towards and helps you track your performance and determine whether you are meeting your goals.
Status thresholds: They are predetermined ranges or values that classify the performance of a metric into different categories. They act as boundaries for determining whether the version is on track, above or below the target. To make it visually appealing, status thresholds are often represented using colour-coded indicators like green for success, yellow for caution, and red for underperformance. These indicators help you quickly assess how well you are doing and identify areas that may need attention.
Key features of the KPI
A KPI is a visual that shows the progress and status of a metric compared to a target. Some of the key features of a KPI indicator are:
a) Indicator: This shows the actual value of the metric and how it compares to the target value. The indicator can be coloured red, yellow, or green based on the distance from the target.
b) Trend axis: This shows the historical values of the metric over time. The trend axis can be either a line or a bar chart, depending on the chart type option.
c) Target goal: This shows the desired value of the metric that you want to achieve. The target goal can be a fixed number or a measure from your data.
d) Icons: This shows small icons next to the indicator value that indicate whether the value is increasing or decreasing compared to the target. A green checkmark means increasing, and a red exclamation point means decreasing.
e) Callout value: This controls how the indicator value is displayed, such as the units, decimal places, and font style.
Learn how to leverage the full potential of Microsoft BI tools and transform raw data into actionable insights with our Microsoft BI Training. Sign up now!
Uses of KPIs
By using KPIs in Power BI reports, you can easily monitor your progress and identify areas of improvement. There are two key reasons why you should incorporate KPIs into your Power BI reports:
a) Tracking progress: KPIs help you track and evaluate the positive or negative changes happening over time. They enable you to assess whether you achieve accurate results, meet set targets, or stay caught up. By comparing current performance with historical data, KPIs provide insights into your progress and highlight improvement areas.
b) Measuring the distance to a target: KPIs in Power BI also help you see how far you are from reaching your goals. They measure the difference between your current performance and the desired target. This allows you to identify where you may be falling short and enables you to take necessary actions to close the gap and get closer to achieving your objectives.
Requirements for KPI
To create a KPI in Power BI Desktop, you need three essential elements: a base measure value, a target value, and a trend or threshold value. The base measure represents the value you want to evaluate. Select a goal, target, and base value from your dataset to build your Power BI report. The following section will explore creating a KPI by incorporating these values from your dataset.
Steps to create a KPI visualization in Power BI Desktop
You must be wondering how to create KPIvisualisation in Power BI. So let's discuss the steps to create a KPI in Power BI:
Step 1: Open your report editor, connect to your data source
Step 2: Once you have imported your data, navigate to the "Fields" pane on the right-hand side of the screen.

Step 3: After clicking on the KPI visualisation, you will get three blank spaces in the field section: Indicator, trend axis, and target measure.

Master the basics of data visualisation in Power BI with our Microsoft Power BI Training & Certification Course today!
Step 4: After selecting the field values and dragging the values to the value, trend axis, and target column, we get the sum of the actual and the sum of the target by month.

Step 5: To get the sum of values column-wise, you can separately choose the column to generate individual values from the slicer

Step 6: You can also format this KPI by selecting the paint icon from the format section. You can select properties from this section like indicator, goal, trend axis, colour coding, background and title, etc.
Learn how to create powerful reports with our Microsoft Power BI Certification Training!

Step 7: You can access all the add-on visualisations from the Power BI visuals marketplace dialogue box.

Power BI KPI prerequisites
There are some prerequisites to using KPIs in Power BI which include:
a) Data availability: Ensure you have access to the necessary data sources that contain the metrics you want to measure using KPIs.
b) Data preparation: Organize and clean your data to ensure its accuracy and consistency for KPI analysis.
c) Power BI desktop: Install Power BI Desktop, the tool for creating reports and visualisations.
d) Data modelling skills: Gain a basic understanding of data modelling concepts to create KPIs in Power BI effectively.
e) Key metrics identification: Determine the specific metrics and KPIs that suit your goals and objectives.
f) Power BI visualisation: Familiarise yourself with Power BI's visualization capabilities to present KPIs effectively.
Considerations and troubleshooting
If the appearance of your KPI in Power BI doesn't match the provided image, you may need to sort your data by fiscal month or month number before converting it into a KPI. In certain older versions of Power BI, KPIs lack a built-in sorting option, so sorting your data beforehand is necessary. You can transform data into meaningful insights, opening opportunities for career advancement.
Now that you understand the Power BI, you can leverage its capabilities to accomplish intelligent tasks. For instance, you can create custom visuals in Power BI, allowing you to further customise your reports and Power BI Dashboards. This encourages you to present data in a way that best suits your specific needs and enhances the overall visual experience for your audience.
Unlock the power of social media analytics with our comprehensive Social Media KPIs And Reports Training . Join us to master data-driven success!
Power BI KPI dashboards: Examples
A Power BI KPI dashboard is a type of dashboard that focuses on Key Performance Indicators (KPIs), which are measurable values that show how well you are achieving your business goals. Here are few examples of Power BI KPI dashboards:
Sales and production analytics dashboard
This dashboard shows the sales performance and production efficiency of a manufacturing company. It has three main sections: Sales and production insights, overall equipment effectiveness, and production details. You can use this dashboard to compare your sales revenue, gross margin, and return on sales across different product categories, customer segments, and sales channels. You can also monitor the productivity and quality of your production machines and identify the sources of waste or inefficiency.
Sales and production insights
This section shows the overall sales revenue, gross margin, and return on sales for the selected period and region. It also shows the breakdown of sales by product category, customer segment, and sales channel. You can use this section to compare your sales performance across different dimensions and identify the most profitable products, customers, and channels.
Overall Equipment Effectiveness(OEE)
This section shows the overall equipment effectiveness (OEE) of your production machines, which is a measure of how well they are utilised and how efficiently they operate. OEE is calculated as the product of three factors: Availability, performance, and quality. Availability measures the percentage of time that the machines are running without unplanned or planned stops. Performance measures the percentage of the maximum possible speed that the machines are operating at. Quality measures the percentage of good parts that the machines produce without defects or rework. You can use this section to monitor the productivity and quality of your production process and identify the sources of waste or inefficiency.
Conclusion
We hope by reading this blog, you could understand Power BI KPIs in detail. Power BI KPIs provide a powerful way to measure and visualise key metrics, enabling you to track progress and make data-driven decisions. With Power BI KPIs, you can easily monitor performance, assess the distance to targets, and gain valuable insights for your business.
Master the art of resolving data quality issues with our Microsoft Power BI Data Analyst PL300 course!
Frequently Asked Questions

The Knowledge Academy


Global Training Provider
The Knowledge Academy is a world-leading provider of professional training courses, offering globally recognised qualifications across a wide range of subjects. With expert trainers, up-to-date course material, and flexible learning options, we aim to empower professionals and organisations to achieve their goals through continuous learning.
 If you wish to make any changes to your course, please


