




We may not have the course you’re looking for. If you enquire or give us a call on 01344203999 and speak to our training experts, we may still be able to help with your training requirements.
Advantages and Disadvantages of Tableau: A Detailed Explanation
ByThe Knowledge AcademyLast updated on: 18 September 2026
Explore the key advantages and disadvantages of Tableau, from interactive data visualisation, integration and analytics to cost, customisation and workflow challenges. Learn key considerations for deciding whether Tableau suits your analytics needs.

You are staring at rows of sales figures, customer data and regional performance numbers. The information is there, but the story behind it is difficult to spot. Now picture turning that same data into interactive dashboards and visualisations that make patterns easier to explore.
That is where Tableau comes in. Its data visualisation, integration and analytical capabilities can help users make sense of complex information, but every tool has its trade-offs. From ease of use to data exploration and customisation, this blog explores the key advantages and disadvantages of Tableau. This will help you understand where it shines and where challenges may arise. So, read on!
Advantages of Tableau
Tableau offers a range of advantages across industries. Its unique capabilities of data integration, visualisation, and geospatial integration make it one of the most popular data visualisation tools in business analytics. Some of its unique advantages are as follows:
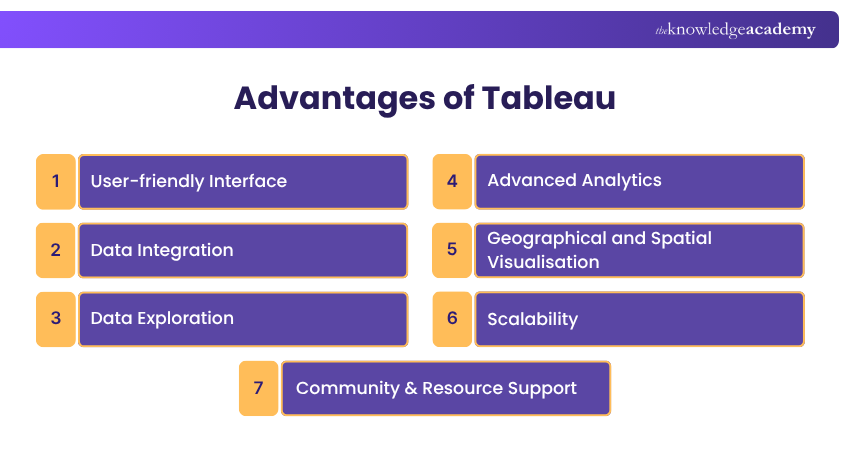
1) User-friendly Interface
Tableau's interactive, easy-to-use interface is one of its main advantages. It provides a visual drag-and-drop interface that allows users to build charts, dashboards and analyses without writing extensive code. Its simple design helps users make high-end visualisations even without having advanced programming skills.

2) Data Integration
Tableau supports various data file types, allowing users to upload files and create a report. It also has a unique feature to blend and join the data to combine and analyse information from different sources. You can connect to spreadsheets, databases, cloud platforms, or other supported data sources.
3) Data Exploration
Tableau is capable of making interactive dashboards, enabling users to engage with data with the help of filters and editing tools. This helps users select specific data points and create real-time insights. With the help of detailed analysis of data sets, Tableau also helps in exploring the latest industry trends and identifying potential hazards or risks. Tableau's quick insight feature enables rapid analysis of large data sets, which helps make time-bound decisions.
Pro Tip
Start each dashboard with a clear business question. Add filters, metrics and visualisations only when they help users answer that question.
4) Advanced Analytics
Tableau integrates efficiently with some of the most advanced analytics and statistical tools through its visualisation capabilities. This makes the complex analysis process easier and helps users with predictive modelling, clustering, and trend identification.
5) Geographical and Spatial Visualisation
One of the salient features and advantages of Tableau is its ability to visualise spatial data to make geographical and spatial analysis. In Tableau, you can create maps with multiple layers and overlays, which helps create detailed location-based reports. Some of the applications of geographical visualisation on Tableau are logistics planning, market segmentation, and regional trend analysis, assisting businesses to make informed decisions.
6) Scalability
Tableau is designed to manage large and complex datasets. It is capable of meeting the requirements of both small and large-scale organisations with large volumes of data. This makes Tableau a preferred choice for data visualisation by various organisations.
7) Community & Resource Support
Tableau offers an engaging community and support options to make the process seamless. Users can access numerous online resources like articles, tutorials, documents and more. Users can also access step-by-step guides on a wide range of functionalities, including advanced techniques.
Turn complex datasets into compelling visual stories with Data Visualisation Training with D3 – Register today!
Disadvantages of Tableau
Understanding Tableau also means considering the areas that may present challenges. The significance of these limitations depends on factors such as organisational requirements, analytics workflows and available resources:
1) Cost Considerations
Cost can be an important consideration when adopting Tableau, particularly for organisations that require paid capabilities across multiple users. Although Tableau Public provides a free option, it is designed for publicly shared visualisations rather than private business data, and some capabilities, such as data refresh, are limited.
Pro Tip
When assessing cost, consider the complete deployment rather than the licence alone. Think about how many users need access and what capabilities and ongoing analytics requirements you have.
2) Visual and Formatting Limitations
Tableau offers extensive visual and formatting options, but highly customised layouts, pixel-specific designs or unconventional visual treatments can require additional configuration or workarounds. Organisations with strict branding or presentation requirements should assess whether Tableau's native formatting options are sufficient.
3) Data Preparation Requirements
Tableau includes data preparation capabilities, particularly through Tableau Prep, which supports cleaning, shaping, combining and aggregating data. However, complex data preparation workflows may still require additional planning, tools or processes before the data is ready for analysis.
4) Learning Curve for Advanced Features
Tableau's basic visualisation features can be relatively accessible, but advanced calculations, complex dashboards, data modelling and administration can require additional knowledge and practice. Users may therefore need further training as their analytics requirements become more sophisticated.
5) Version Control Considerations
Tableau Cloud and Tableau Server provide revision history for published workbooks and data sources, allowing authorised users to view and restore previous versions. However, teams requiring advanced source-control workflows may need additional processes or tools to manage complex development and collaboration requirements.
6) Complex Collaborative Workflows
Tableau Cloud and Tableau Server support collaboration through content sharing, web editing, comments, subscriptions and permissions. However, complex workflows involving multiple people editing and publishing the same workbook may require careful coordination and governance to avoid conflicting or overwritten changes.
Is Tableau Right for You?
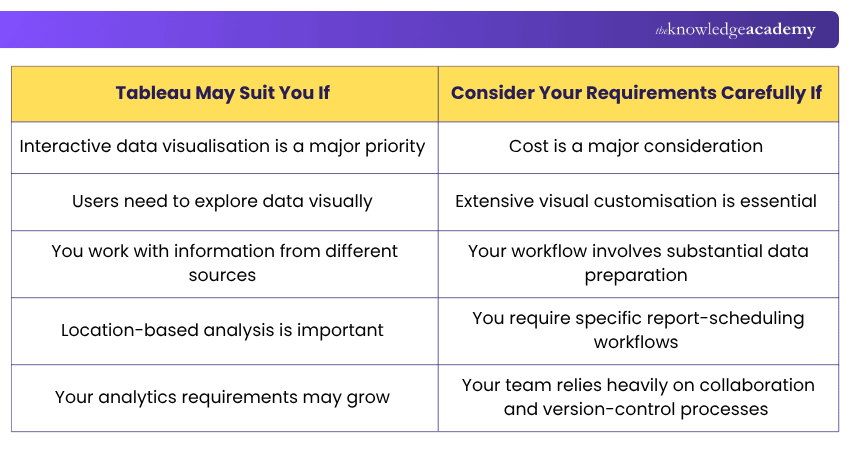
Knowing Tableau's advantages and disadvantages is only useful when you compare them against your actual requirements. A capability that is essential for one organisation may be unnecessary for another. Consider factors such as your visualisation goals, data sources, users, analytics workflows, collaboration needs and available resources before deciding.
Keep This in Mind
Choosing Tableau is not only about its features, but also about how well it supports your business goals and working environment. A tool that works well for one organisation may not be equally suitable for another.
1. Match Tableau's capabilities with your reporting and analytics needs2. Consider the learning curve for advanced features3. Review performance requirements for large or complex datasets
Develop the skills to analyse, visualise, and communicate data with Business Intelligence Reporting Training – Join now!

The Knowledge Academy develops accessible learning content across Project Management, IT, Cybersecurity, Data Science, Business Analysis, HR, Accounting and Finance, Leadership and Health and Safety. Its resources combine subject research with clear explanations to help professionals build practical knowledge across a wide range of disciplines.
View Detail

 If you wish to make any changes to your course, please


