


 Top Rated Course

We may not have the course you’re looking for. If you enquire or give us a call on 01344203999 and speak to our training experts, we may still be able to help with your training requirements.
R Programming Tools
Richard Harris 04 September 2026R Programming Tools support different stages of data analysis, from data manipulation and statistical analysis to visualisation, Machine Learning (ML) and interactive reporting.

Training Outcomes Within Your Budget!
We ensure quality, budget-alignment, and timely delivery by our expert instructors.
Table of Contents

Key Takeaways
1. R Programming Tools streamline various aspects of data analysis, from data preparation to presenting insights.2. dplyr simplifies common data manipulation and transformation tasks.3. ggplot2 provides a flexible approach to creating informative data visualisations.4. Statistical, Machine Learning and interactive application tools extend R beyond basic data analysis.5. Choosing tools according to the task can create a more focused and efficient R workflow.
Imagine receiving a large customer dataset containing thousands of records, missing values and inconsistent categories. Before you can extract useful insights, you need to clean the data, analyse relationships, visualise patterns, build predictive models and communicate the results.
Trying to handle every stage with the same approach can quickly become inefficient.
This is where R Programming Tools come in to provide specialised packages and built-in capabilities for different parts of this workflow. These help Data Analysts, Researchers and other data professionals derive clear meaning from raw information.
What are R Programming Tools?
R Programming Tools are packages, libraries and built-in capabilities that extend or support what users can accomplish with the R programming language. They can assist with tasks such as data manipulation, statistical analysis, visualisation, Machine Learning and interactive application development.
Different tools serve different purposes. For example, one package may help transform raw datasets, while another creates visualisations or supports predictive modelling. Using suitable tools can help make R workflows more organised and efficient.
Why are R Programming Tools Important?
R provides a broad ecosystem of packages and functions for working with data. These tools can help users reduce repetitive coding, structure analytical workflows and apply specialised techniques to different problems. Some key reasons R Programming Tools are useful include:
1) Efficient Data Preparation: Tools can simplify filtering, transforming, cleaning and organising datasets.
2) Statistical Analysis: R provides functions and packages for techniques such as regression, hypothesis testing and time-series analysis.
3) Data Visualisation: Visualisation packages can transform analytical results into understandable charts and graphs.
4) Machine Learning: Dedicated tools can support model training, preprocessing, tuning and evaluation.
5) Interactive Presentation: Applications and dashboards can allow users to explore analytical findings dynamically.
6) Workflow Efficiency: Complementary tools can be connected to create more structured data analysis processes.
Essential R Programming Tools
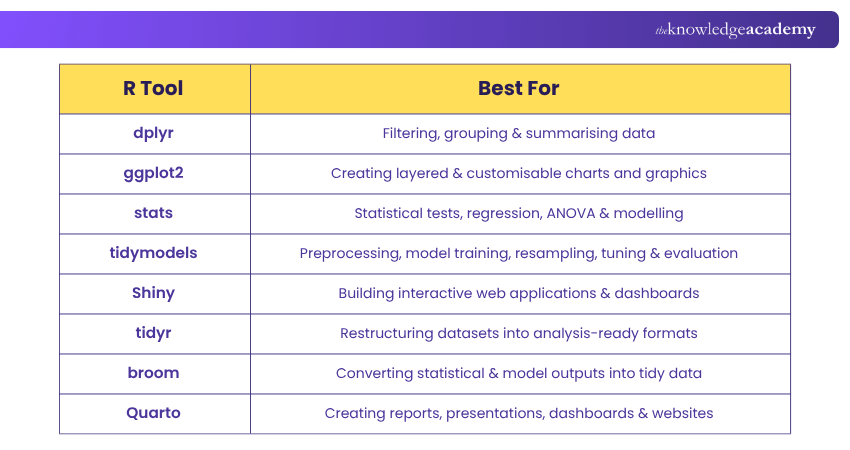
Different R Programming Tools specialise in different parts of data analysis. Before exploring each one, here is a quick comparison of the major tools:
1) dplyr for Data Manipulation
dplyr is designed to simplify data manipulation in R. It provides functions such as filter(), select(), mutate() and group_by() that can help users clean, filter, transform and organise datasets before analysis.
Its straightforward approach makes it useful for building structured data-processing workflows. It can also work alongside packages such as ggplot2 and tidyr, allowing transformed data to move into other stages of analysis.
Real-world Example: A Data Analyst could use dplyr to filter customer records for a marketing analysis, group sales data by region and summarise performance before creating a report. The original article similarly uses marketing, sales reporting and survey transformation as practical examples.
Pro Tip
Before adding a package to an important workflow, review its documentation, compatibility, dependencies and maintenance status. This can help reduce problems when your R environment or related packages change.
2) ggplot2 for Data Visualisation
ggplot2 is a flexible R package for creating data visualisations. It is based on the Grammar of Graphics, which allows users to construct plots by combining different graphical components. Its layering approach supports elements such as geometric objects, aesthetic mappings and facets. This enables users to create anything from straightforward scatter plots and bar charts to more detailed visualisations.
Real-world Example: A Data Analyst could use ggplot2 to display monthly sales trends, compare performance between regions or visualise survey responses to make patterns easier to understand.
3) stats for Statistical Analysis
The stats package is included with R and provides functions for a variety of statistical analyses. The supplied article highlights techniques including hypothesis testing, linear and nonlinear regression, Analysis of Variance (ANOVA) and correlation analysis.
These capabilities can help Researchers and Analysts examine relationships, test assumptions and draw conclusions from data.
Real-world Example: Researchers could use statistical functions to test hypotheses in an experiment, investigate relationships between variables or analyse survey results.
4) tidymodels for Machine Learning and Modelling
tidymodels is a collection of R packages designed to support modelling and machine learning workflows using consistent principles and interfaces. It provides tools for tasks such as data splitting, preprocessing, model specification, resampling, tuning and performance evaluation.
Its integrated approach helps users organise different stages of the modelling process within a structured workflow and work with a variety of statistical and machine learning models.
Real-world Example: A Data Analyst could use tidymodels to prepare customer data, train and tune different classification models and evaluate their performance when predicting customer churn.
Explore the power of Data Science through R Programming. Sign up for our Data Science with R Training now!
5) Shiny for Interactive Applications and Dashboards
Shiny enables users to create interactive web applications directly with R. Rather than presenting analysis only through static outputs, users can build interfaces that allow others to interact with data and analytical results. Shiny combines data analysis, visualisation and user-interface elements to support interactive dashboards and applications.
Real-world Example: A Data Analyst could create an interactive dashboard that lets business users filter sales results by location, time period or product category and view updated charts based on their selections.
Pro Tip
Combine complementary tools instead of treating every package independently. A connected workflow can move data from cleaning and analysis to visualisation and presentation with fewer unnecessary manual steps.
6) tidyr for Data Tidying and Reshaping
tidyr helps users organise data into consistent, tidy structures that are easier to analyse. It provides functions for reshaping datasets, separating or combining columns and working with different data structures. It works particularly well alongside dplyr, allowing data to be reshaped before transformation, analysis or visualisation.
Real-world Example: A Data Analyst could use tidyr to convert monthly sales columns into rows, separate combined customer information into individual fields or restructure survey data before analysis.
7) broom for Tidying Model Outputs
broom converts outputs from statistical models and tests into tidy data structures that are easier to analyse, combine and visualise. Instead of manually extracting information from complex model objects, users can organise coefficients, statistics and other model results into tabular formats that work well with tools such as dplyr and ggplot2.
Real-world Example: A Data Analyst could use broom to extract regression coefficients into a tidy table, compare results across several models and visualise model estimates using ggplot2.
8) Quarto for Reproducible Publishing
Quarto is an open-source publishing system that can combine R code, analytical results, text and visualisations within reproducible documents. It can be used to create reports, presentations, websites, dashboards and other analytical outputs.
It is particularly useful for communicating analysis because code and its resulting tables or visualisations can be incorporated into the same publishing workflow.
Real-world Example: A Data Analyst could use Quarto to create a monthly performance report containing explanatory text, R-generated charts and analytical results, then reproduce the report when new data becomes available.
How R Programming Tools Work Together?
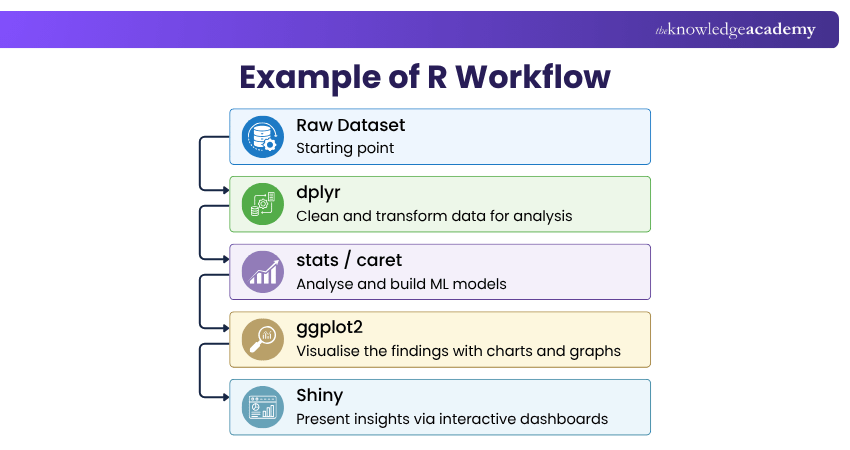
R tools become particularly useful when they are combined into a connected workflow. Instead of completing each stage independently, data can move from preparation through analysis and eventually into a visual or interactive output. Consider this example:
Step 1: Prepare the Data With dplyr
Begin by cleaning and transforming the raw dataset. Remove unnecessary records, select relevant variables, create new fields and summarise the information required for analysis. This creates a cleaner and more consistent dataset for the next stage of the workflow.
Step 2: Analyse the Data With stats
Apply appropriate statistical techniques to investigate relationships, test hypotheses or understand patterns within the prepared dataset. The results can help reveal meaningful trends, relationships and differences in the data.
Step 3: Build Models with Machine Learning Tools
Where predictive analysis is required, Machine Learning tools such as caret can support preprocessing, model training, tuning and evaluation. This enables Analysts to move from understanding past data to generating predictive insights.
Step 4: Visualise Results With ggplot2
Transform important findings into charts and graphs that make patterns, comparisons and relationships easier to understand. Clear visualisations can also make complex analytical results easier to communicate to different audiences.
Step 5: Present Insights With Shiny
Where users need to interact with the analysis, create a Shiny application or dashboard that allows them to explore results dynamically. This turns static findings into an interactive experience that supports deeper exploration and decision-making.
Factors to Consider When Choosing R Tools
Consider these factors before introducing a tool into your workflow:
1) Define Your Task: Identify whether you need data manipulation, statistical analysis, visualisation, modelling or interactive presentation.
2) Check Compatibility: Consider how well the package works with your R environment and other packages in your workflow.
3) Consider Ease of Use: Evaluate whether the package's syntax, documentation and workflow suit your current R knowledge.
4) Review Integration: Look at how easily the tool can exchange data or outputs with other tools you already use.
5) Consider Workflow Complexity: Avoid adding packages that unnecessarily duplicate capabilities already available in your existing toolkit.
6) Evaluate Your Requirements: Choose tools according to the complexity and purpose of the analysis rather than simply selecting the largest number of features.
Conclusion
R Programming Tools can handle a lot of work; from transforming raw datasets with dplyr and analysing them with stats to creating visualisations with ggplot2, building models with Machine Learning tools and presenting findings through Shiny. Choosing tools according to the task and combining complementary capabilities can help create more practical R workflows.
Become a creative Coder and stand out in the world of Programming. Sign up for our range of Programming Courses now!
Frequently Asked Questions
Can Multiple R Packages be Used in the Same Project?

Yes. Multiple packages can be used within the same R project or script, allowing users to combine capabilities for data manipulation, analysis, visualisation and other tasks. However, packages can sometimes contain functions with the same names, creating conflicts that need to be managed.
Should R Packages Be Updated Regularly?
R packages should be reviewed for updates periodically, particularly when maintaining active projects. R provides update.packages() for identifying and installing suitable newer versions, but updates should be tested because changes can affect dependencies or existing workflows.
What Should You Do if Two R Packages Have Conflicting Functions?
Function conflicts can occur when different packages provide objects with the same name. R can report these conflicts, and users can manage them by controlling which packages or functions are used and, where appropriate, referring explicitly to functions from a particular package.
Which is better, R or Python?
Neither Python nor R is universally better; the right choice depends on your goal. Python is a general-purpose language ideal for Machine Learning, web integration, and production deployment. R is built specifically for statistics, data exploration, and advanced data visualisation.
Is R Programming in Demand?
Yes, R Programming is in demand, but it has shifted into a specialised, high-value skill. While Python dominates general Data Science and software engineering, R remains heavily sought after in industries that rely deeply on advanced statistics, academic research, and complex data visualisation.

Richard Harris


Senior Full Stack Developer and Technology Educator
Richard Harris is a highly experienced full-stack developer with deep expertise in both frontend and backend technologies. Over his 12-year career, he has built scalable web applications for startups, enterprises and government organisations. Richard’s writing combines technical depth with clear explanations, ideal for developers looking to grow in modern frameworks and tools.


 If you wish to make any changes to your course, please


