


We may not have the course you’re looking for. If you enquire or give us a call on 01344203999 and speak to our training experts, we may still be able to help with your training requirements.
Kubernetes Monitoring Tools: Features, Comparison & Benefits
ByVishnu SankarLast updated on: 17 September 2026
Kubernetes Monitoring Tools help teams track cluster health, resource usage, application performance, and workload behaviour.
Kubernetes environments are constantly changing as pods scale, workloads move between nodes and applications consume varying levels of resources. Without proper monitoring, performance issues, resource constraints, and workload failures can become difficult to identify and troubleshoot.
Kubernetes Monitoring Tools provide visibility into clusters, containers, applications, and infrastructure through metrics, logs, traces, dashboards, and alerts. From Prometheus and Grafana to Jaeger, Datadog, and Dynatrace, different tools support different areas of Kubernetes observability.
What are Kubernetes Monitoring Tools?
Kubernetes Monitoring Tools are software solutions that collect and analyse metrics, logs, and health data to track the performance and condition of Kubernetes clusters, nodes, pods, and containers. These tools serve several crucial purposes. They help maintain application reliability by tracking performance in real-time and resolving issues promptly.
Security-related monitoring can also help teams identify unusual activity, configuration issues and policy violations. Moreover, monitoring resource usage can provide useful data for identifying inefficient resource allocation and supporting cost optimisation.
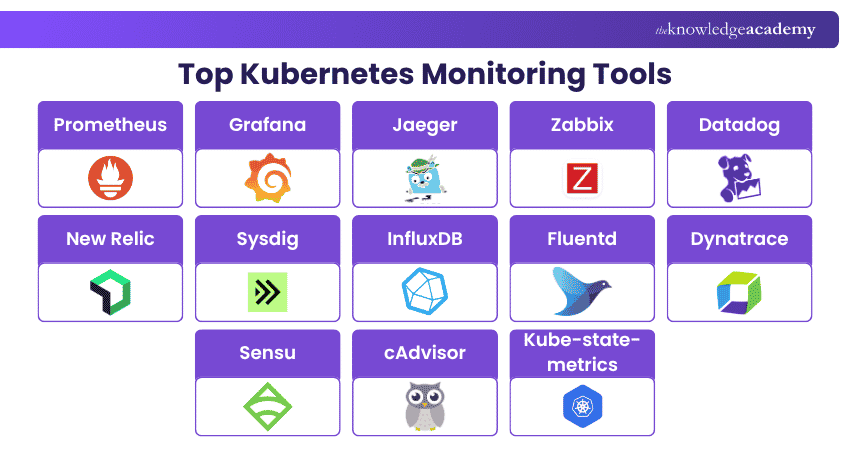
Top Kubernetes Monitoring Tools
When managing Kubernetes, the right monitoring tools are essential to maintain system health and performance. Below is a list of the top monitoring tools for Kubernetes to help you make the best choice for your setup.
1) Prometheus
Prometheus is highly favoured in the Kubernetes ecosystem. It is one of the best monitoring tools for Kubernetes. Let’s explore its key features:
a) Real-time Monitoring: It scrapes metrics at specified intervals. This provides real-time insight into system health.
b) Query Language: PromQL allows you to perform complex queries. This feature is vital for deep Data Analysis.
c) Integration: Prometheus supports Kubernetes service discovery, allowing it to discover and scrape metrics from relevant targets within Kubernetes environments.
d) Alerting: You can configure alerts based on specific conditions. Notifications are sent through different channels, such as email or Slack.
e) Scalability: It support a wide range of monitoring environments, although larger or highly distributed deployments may require additional architecture for long-term storage, high availability or horizontal scaling.
f) Community Support: A strong community backs Prometheus. Regular updates and extensive documentation are available.
g) Exporter Feature: Custom exporters let you monitor various services. It can even track non-standard applications.
h) Storage: Time-series database storage is a feature. This format is great for real-time monitoring.
i) Alertmanager: Prometheus alerting rules send alerts to Alertmanager, which handles functions such as grouping, inhibition, silencing and routing notifications to configured receivers.
j) Visualisations: While it doesn't rival Grafana, Prometheus does offer basic visualisations. This is useful for quick checks.
2) Grafana
Grafana is an observability and visualisation platform commonly used with Kubernetes monitoring systems such as Prometheus. Rather than replacing metric collectors, it helps teams explore telemetry data through dashboards, queries, and alerts.
a) Custom Dashboards: Create dashboards that display Kubernetes infrastructure and application data using graphs, tables, gauges, and other visualisations.
b) Multiple Data Sources: Grafana integrates with Prometheus and numerous other metrics, logging, tracing, and database platforms.
c) Alerting: Grafana Alerting lets teams define alert conditions across supported data sources and route notifications through configured contact points.
d) Dashboard Templates: Pre-built and community-created dashboards can simplify the initial monitoring setup.
e) Annotations: Annotations can add contextual information, such as deployments or incidents, to dashboard visualisations.
f) Plugins: Grafana's plugin ecosystem extends its available data sources, applications, and visualisation capabilities.
g) Access Management: Grafana provides user and access-control capabilities for managing who can view or modify monitoring resources.
3) Jaeger
Jaeger is an open-source distributed tracing platform used to observe requests as they travel across microservices and distributed applications. In Kubernetes environments, it is especially useful for understanding service dependencies and diagnosing latency problems.
a) Distributed Tracing: Jaeger records and visualises traces made up of spans, helping teams follow requests across multiple services.
b) Root Cause Analysis: Trace data can help identify which service or operation contributes to latency or failed requests.
c) Performance Analysis: Teams can use traces to investigate bottlenecks and understand where applications spend time while processing requests.
d) OpenTelemetry Support: Jaeger can receive trace data using the OpenTelemetry Protocol (OTLP), making it compatible with modern OpenTelemetry-based instrumentation.
e) Trace Visualisation: The Jaeger UI allows teams to search, inspect, and compare traces and understand relationships between services.
f) Flexible Deployment: Jaeger can be deployed in different configurations depending on workload size and storage requirements.
Understand CI/CD pipelines, tools, and application release automation with our DevOps Engineering Foundation Course – Join now!
4) Zabbix
Zabbix is an open-source monitoring platform that can be used to monitor servers, networks, applications, virtual machines, cloud infrastructure, and Kubernetes environments.
a) Discovery: Zabbix can discover infrastructure resources and reduce the amount of manual monitoring configuration required.
b) Metrics Collection: It supports a range of monitoring methods for collecting infrastructure and application metrics.
c) Alerting: Teams can define trigger conditions and route notifications when monitored systems experience problems.
d) Visualisation: Dashboards, graphs, maps, and reports help teams analyse infrastructure health and performance.
e) Inventory Management: Zabbix can maintain inventory information about monitored hosts and infrastructure.
f) Customisation: Templates, scripts, integrations, and user-defined monitoring items allow organisations to adapt Zabbix to different environments.
5) Datadog
Datadog provides real-time visibility into Kubernetes environments, helping teams monitor clusters, nodes, pods, and containers through dashboards, alerts, logs, and performance data.
a) Integration: It has out-of-the-box Kubernetes support. Integrating Datadog is simple and straightforward.
b) Custom Metrics: You can define metrics that are specific to your use case. This enables more focused monitoring.
c) Dashboard: The Datadog dashboard is intuitive. It makes real-time monitoring easier for all team members.
6) New Relic
New Relic is an observability platform that helps monitor the performance, health, and availability of applications and infrastructure, including Kubernetes environments, using metrics, logs, traces, and alerts.
a) APM Features: Advanced application performance monitoring tools are available, including error tracking and user monitoring.
b) Real-time Analytics: New Relic gives you real-time analytics. Make data-driven decisions more effectively.
c) Custom Dashboards: Design dashboards to show the metrics that matter most to you. This allows for targeted monitoring.
7) Sysdig
Sysdig offers both commercial and open-source solutions for Kubernetes monitoring, security and troubleshooting. Its open-source tools help teams analyse container activity and detect suspicious behaviour. Its commercial platform provides broader capabilities for Kubernetes with observability, runtime security, compliance, and threat detection across cloud-native environments.
a) Security Features: Sysdig is known for its focus on security. Monitor for suspicious activity and potential breaches.
b) Container Insights: Get in-depth metrics for your containers. This is vital for optimising container performance.
c) Easy to Use: The Sysdig interface is user-friendly. This makes it accessible even for those new to Kubernetes monitoring.
8) InfluxDB
InfluxDB is a time-series database that can serve as a telemetry storage component in a Kubernetes monitoring architecture. It is designed for workloads that generate time-stamped data, including infrastructure and application metrics.
a) Time-series Storage: InfluxDB is designed to ingest and store time-series and event data generated by monitoring systems and applications.
b) Fast Queries: It supports querying time-series information for dashboards, monitoring, analytics, and automation use cases.
c) Monitoring Integrations: InfluxDB can work with telemetry collection and visualisation tools to form part of a broader Kubernetes observability stack.
d) Data Processing: Current InfluxDB releases provide processing capabilities that can support transformations, monitoring workflows, and notifications.
e) Deployment Options: InfluxDB capabilities vary by edition. InfluxDB 3 Core is an open-source, single-node option, while Enterprise and Clustered offerings provide additional capabilities such as multi-node deployment and high availability.
9) Fluentd
Fluentd is an open-source log collector ideal for Kubernetes. It efficiently aggregates, filters, and routes logs to various destinations, making it a flexible and reliable tool for centralised log management. Key features include:
a) Data Routing: It can route logs to multiple destinations. This includes databases and cloud storage solutions.
b) Plugin-based Architecture: It supports a broad plugin ecosystem for collecting, processing and routing logs between different data sources and destinations.
c) Community Support: Fluentd is an open-source project with an active community and a broad ecosystem of plugins.
d) Data Transformation: You can modify and filter data as it gets processed. This enables more sophisticated Data Analytics.
e) Reliability: Fluentd has a robust buffering mechanism. This prevents data loss during transient network issues.
10) Dynatrace
Dynatrace is an observability platform that provides monitoring across Kubernetes applications, services and infrastructure. Key features include:
a) End-to-End Visibility: Dynatrace provides full-stack monitoring across applications, services, and infrastructure components.
b) AI-Powered Insights: It uses Artificial Intelligence for automatic anomaly detection and root cause analysis.
c) Proactive Issue Resolution: Performance issues are identified and addressed early, reducing downtime and disruption.
d) User Experience Monitoring: Offers deep insights into user behaviour, application paths, and dependencies.
e) Multi-Cloud Support: Seamlessly supports microservices, multi-cloud environments, and containerised applications.
f) Custom Dashboards: Allows the creation of tailored dashboards and reports for focused performance analysis.
g) Team Collaboration: Facilitates better coordination between DevOps and IT teams for faster resolutions.
h) Digital Experience Optimisation: Helps businesses deliver high-performing, reliable digital services to users.
Become familiar with the workings of configuration integration with our Jenkins Training For Continuous Integration - Register now!
11) Sensu
Sensu is an observability pipeline that can collect monitoring events and metrics, process them, and route them to different storage and notification systems.
a) Kubernetes Compatibility: Sensu agents and monitoring components can be deployed within containerised and Kubernetes environments.
b) Prometheus Integration: Sensu can collect metrics from Prometheus exporters or query the Prometheus API, allowing the two systems to work together within an observability architecture.
c) Event Processing: Monitoring data can be processed through Sensu's event pipeline before being sent to handlers or external systems.
d) Flexible Routing: Sensu can route metrics and monitor events to external platforms and time-series databases.
e) Agent-based Checks: Sensu agents can execute monitoring checks and send resulting events to the Sensu backend for processing.
12) cAdvisor
cAdvisor, or Container Advisor, is an open-source tool focused on collecting and exporting resource usage and performance data from containers. Here are some key aspects of cAdvisor:
a) Node-level Deployment: Unlike many other monitoring agents that operate at the pod level, cAdvisor functions at the node level. This means it automatically identifies and tracks all containers running on a specific machine, effectively capturing essential system metrics like memory, CPU, and network usage.
b) Simplicity and Integration: cAdvisor is favoured for its simplicity and user-friendliness. It effortlessly exposes Prometheus metrics by default, making it an easily accessible monitoring tool. However, cAdvisor alone does not provide all the capabilities required for a complete monitoring solution in complex or enterprise environments.
13) Kube-state-metrics
Kube-state-metrics is a service that listens to the Kubernetes API and exposes metrics about the state of Kubernetes objects such as deployments, nodes and pods. These metrics are available in plain text via an HTTP endpoint, making them easy to scrape, especially with Prometheus. While useful, it's only one part of a full Kubernetes monitoring setup. Let's look at its key features:
a) Kubernetes-native Metrics: Kube-state-metrics is tailored to generate metrics that reflect the state and status of various Kubernetes objects, making it an ideal choice for Kubernetes environments.
b) Prometheus Integration: The metrics generated by kube-state metrics are designed to be seamlessly integrated with Prometheus, enabling straightforward consumption and scraping.
c) Easy Access: Metrics are easily accessible through the /metrics HTTP endpoint in plaintext format, allowing for straightforward monitoring and analysis.
d) Complementary Component: Kube-state-metrics serves as a valuable component in a complete Kubernetes monitoring solution but is typically used alongside other tools to create a comprehensive system.
e) Insights Into Kubernetes Objects: It exposes metrics about Kubernetes object state, which can complement resource and application metrics collected by other monitoring components.
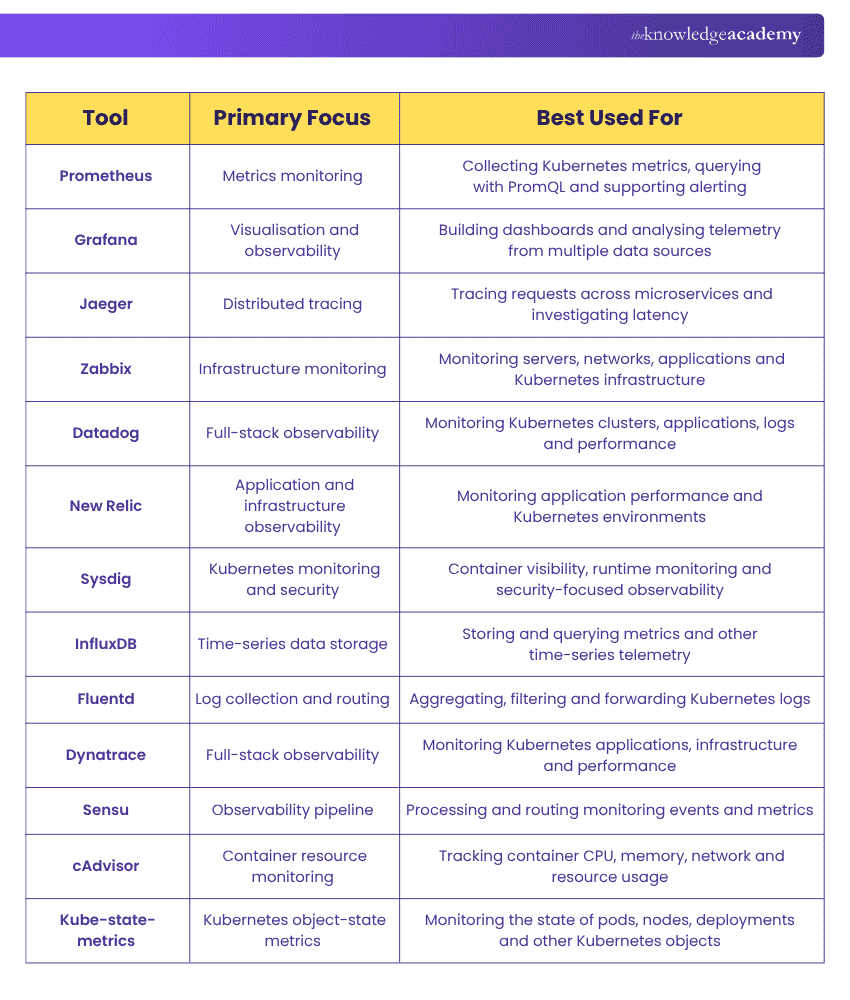
Comparison of Kubernetes Monitoring Tools
Kubernetes monitoring tools serve different purposes, from collecting metrics and visualising telemetry to storing time-series data and routing logs. The table below compares their primary roles and where each tool fits best.
Key Benefits of Kubernetes Monitoring
Below are some of the key benefits of Kubernetes Monitoring:
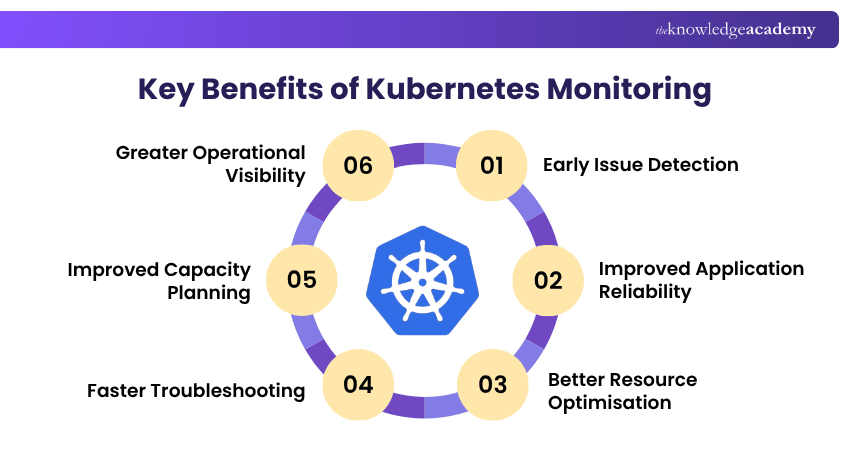
1) Early Issue Detection: Identifies unhealthy pods, failing nodes, and unusual workload behaviour before problems escalate.
2) Improved Application Reliability: Provides visibility into cluster and workload health to support stable application performance.
3) Better Resource Optimisation: Helps teams analyse CPU, memory, storage, and other resources to improve allocation.
4) Faster Troubleshooting: Metrics, logs, and traces make it easier to investigate performance problems and identify root causes.
5) Improved Capacity Planning: Historical monitoring data helps teams understand usage trends and plan infrastructure requirements.
6) Greater Operational Visibility: Provides clearer insight into pods, nodes, containers, applications, and Kubernetes object states across the cluster.
Learn how to use the Ansible Vault with custom scripts and commands with our Ansible Essentials Training – Register today!

Vishnu Sankar is a Senior Content Writer with 5+ years of experience across content development, software development, web development and system administration. His technical background and professional training support his expertise in IT and Tech, while his extensive research and writing experience covers Project Management and Health and Safety.
View Detail

 If you wish to make any changes to your course, please


