


 Top Rated Course

We may not have the course you’re looking for. If you enquire or give us a call on 01344203999 and speak to our training experts, we may still be able to help with your training requirements.
Crystal Reports Tips and Tricks for Better Reports
The Knowledge Academy 29 August 2026This blog explores Crystal Reports Tips and Tricks for designing, organising and reviewing reports effectively. It covers practical tips, tricks and common mistakes to help you get more value from your reports.

Training Outcomes Within Your Budget!
We ensure quality, budget-alignment, and timely delivery by our expert instructors.
Table of Contents

Key Takeaways
1. Start with the report's purpose, audience and required information before designing the layout.2. Retrieve and display only the data users actually need.3. Use parameters, grouping, summaries and formulas based on the report's purpose.4. Keep visual formatting consistent and make important information easy to identify.5. Test data accuracy, calculations, performance and output before distributing a report.
“Can you quickly find last month’s sales figure?”
It sounds like a simple request. But when the answer is buried somewhere inside a 30-page report filled with tables, calculations and charts, finding it may not be simple at all.
That is where thoughtful report design can make a difference. Crystal Reports gives you the tools to organise and present business data, but the real skill lies in deciding what to show, what to simplify and what to leave out. Throughout this blog, you'll learn how to make those choices more deliberately and avoid common reporting mistakes along the way. So, read on!
Before You Start
Define three things before building the report: Audience, Required Information and Intended Action. This will help you choose the right data, calculations, layout and level of detail.
What is Crystal Reports?
SAP Crystal Reports is a reporting application used to design and generate formatted reports using information from supported data sources. It enables users to organise, format, calculate, summarise and visually present data according to specific reporting requirements.
Reports can combine detailed records with elements such as groups, summaries, formulas, parameters and charts. This makes Crystal Reports useful for creating anything from detailed operational reports to summarised information for business analysis.
Creating an effective report therefore involves more than connecting to data. It requires a structured process for selecting, organising, calculating and presenting that information.

Tips for Designing Crystal Reports
An effective Crystal Report should balance accuracy, clarity, usability and performance. The following tips can help you make better design decisions.
1) Define Clear Objectives
Begin by identifying the purpose of the report. Determine what information needs to be communicated, who will use it and what they should be able to understand or do after reviewing it.
Clear objectives help guide decisions about data selection, calculations, layout and level of detail. They can also prevent unnecessary information from being added to the report.
Quick Check
If you cannot explain the purpose of your report in one or two sentences, its objective may need further clarification.
2) Organise Data Effectively
Structure information logically so users can move through the report without unnecessary effort. Keep related information together and use appropriate report sections to distinguish headers, details, summaries and other elements.
Consider what users need to see first. Important summary information should not become difficult to find because the report contains excessive detail.
3) Choose Suitable Fonts and Colours
Use readable fonts and maintain consistent font styles and sizes throughout the report. A clear visual hierarchy can help users distinguish titles, headings, labels and detailed information.
Colours should provide sufficient contrast and have a clear purpose. Avoid using multiple colours simply to make the report look more visually interesting, as excessive formatting can distract from the information itself.
Learn to transform raw data into interactive dashboards and insightful reports with Microsoft Power BI Training – Register now!
4) Utilise White Space
White space can make complex reports easier to scan. Appropriate spacing between headings, tables, sections and data elements prevents the layout from appearing overcrowded.
Rather than filling every available area, use spacing to separate related information and guide the reader naturally through the report.
5) Incorporate Images and Charts
Charts and other visual elements can make comparisons, patterns and trends easier to understand. Select visuals according to the information you want to communicate rather than adding them purely for appearance.
For example, a chart may be useful for showing changes or comparisons, while detailed figures may be more appropriate when users need precise values.
Pro Tip
Every visual element should answer a reporting need. If removing a chart, image or formatting element does not reduce understanding, it may not be necessary.
6) Highlight Key Information
Important figures, exceptions or insights should be easy to identify. Formatting techniques such as bold text, appropriate colour or other visual emphasis can help direct attention to significant information.
Use highlighting selectively. If too many elements compete for attention, genuinely important information can become harder to recognise.
7) Optimise Report Performance
Reports containing large amounts of data or complex calculations can take longer to process. Retrieve only the data required for the report and use appropriate filters and parameters to reduce unnecessary processing.
Where users need consolidated information rather than individual records, summaries and aggregates can also make the report output more focused.
Trainer's Insight
Report performance should be considered during design, not only after users complain that a report is slow. Review whether each field, record and calculation genuinely contributes to the reporting objective.
8) Test and Review
Before finalising a report, test its accuracy, functionality and presentation. Verify the data, formulas and calculations and check whether filters and parameters behave as expected.
Also consider how the report will be used. Review its appearance and usability in the intended output and seek feedback from relevant users or stakeholders where appropriate.
Quick Test
Can users identify the report's most important information without additional explanation? If not, review its structure and presentation.
Transform complex workflows into easy-to-understand visual diagrams with FlowChart and Process Mapping Training – Sign up soon!
Practical Crystal Reports Tricks
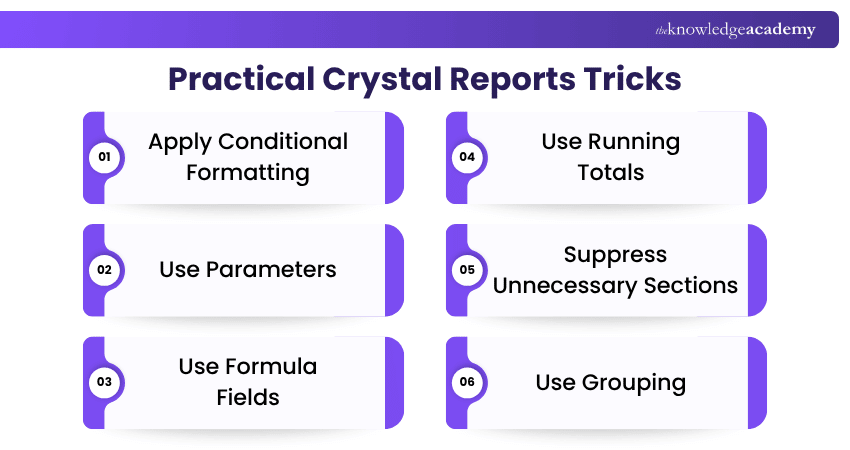
Crystal Reports includes several features that can make reports more flexible, easier to analyse and simpler to maintain. Here are some practical tricks you can use:
1) Apply Conditional Formatting
Use conditional formatting to change how information appears when certain conditions are met. For example, you can highlight unusually high or low values so users can quickly identify figures that need attention.
2) Use Parameters to Make Reports Interactive
Parameters let users choose values, such as a date range, department or region, before viewing a report. This allows one report to serve different reporting needs without creating multiple versions.
3) Use Formula Fields for Custom Calculations
Formula fields allow you to create calculated values or apply custom logic to report data. Keep formulas simple and clearly named so they are easier to understand, test and update.
4) Use Running Totals for Cumulative Values
Running totals are useful when you need cumulative calculations across records or groups. They can help display information such as accumulated sales, quantities or other progressive totals.
5) Suppress Unnecessary Sections
Not every report section needs to appear all the time. Use suppression to hide sections or information when they are empty or not relevant, helping keep the final report cleaner.
6) Use Grouping for Easier Data Exploration
Group related records by fields such as region, department or product category. This helps organise large datasets and allows users to move from summarised information to greater detail where appropriate.
Remember
The most sophisticated report is not necessarily the most useful. Choose features according to the reporting requirement rather than trying to use every available capability.
Common Crystal Reports Mistakes to Avoid
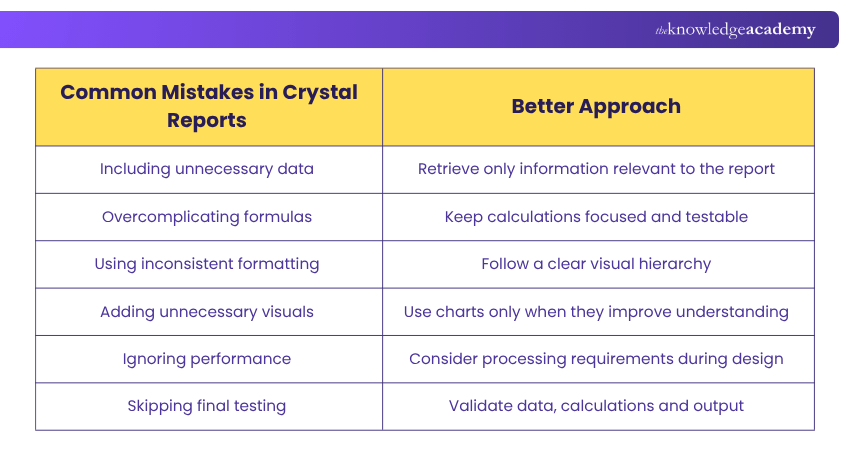
Small mistakes in report design can affect clarity, usability and performance. The table below highlights common issues and the better approach to take:
Crystal Reports Final Review Checklist
Before finalising your report, ask:
Does the report have a clear purpose? Does it contain only the information users need? Are the data and calculations accurate? Have filters and parameters been tested? Can important information be identified quickly? Does the report perform effectively with realistic data volumes? Has the final output been reviewed?If several answers are No, review the report before distributing it.
Conclusion
Effective reporting is ultimately about turning data into information people can understand and use. By applying Crystal Reports Tips and Tricks with a clear purpose, selecting only relevant data and reviewing both usability and performance, you can create reports that do more than present figures. They help users find information that matters.
Develop the ability to turn raw data into meaningful business insights with our Business Intelligence Reporting Training – Join today!
Frequently Asked Questions
Can Crystal Reports Connect to Multiple Data Sources?

Yes. Crystal Reports supports connections to various data sources, although available connections can depend on the product version, drivers and environment. When combining data, consider how the sources relate and how the connection may affect report complexity and performance.
What Skills are Useful for Learning Crystal Reports?
Useful skills include understanding data structures, report design, filtering, grouping, formulas and basic data analysis. Familiarity with databases and SQL can also be valuable when working with more complex reporting requirements.
Can Crystal Reports Create Both Detailed and Summary Reports?
Yes. Crystal Reports can present individual records as well as grouped and summarised information. The appropriate level of detail depends on the report's purpose, audience and the decisions the information needs to support.
What is the Difference Between Grouping and Sorting in Crystal Reports?
Grouping brings related records together based on a selected field, while sorting controls the order in which records appear. They can also be used together, such as grouping sales by region and then sorting records within each region.
How Often Should Crystal Reports be Reviewed?
There is no single review frequency for every report. Review a report when its data source, business requirements, calculations or user needs change. Reports used regularly should also be checked periodically to ensure they remain accurate, relevant and useful.

The Knowledge Academy


Global Training Provider
The Knowledge Academy is a world-leading provider of professional training courses, offering globally recognised qualifications across a wide range of subjects. With expert trainers, up-to-date course material, and flexible learning options, we aim to empower professionals and organisations to achieve their goals through continuous learning.


 If you wish to make any changes to your course, please


