


We may not have the course you’re looking for. If you enquire or give us a call on 01344203999 and speak to our training experts, we may still be able to help with your training requirements.
Top 15 Data Mining Techniques Explained with Examples
ByVishnu SankarLast updated on: 17 November 2026
Data mining techniques help organisations discover meaningful patterns, relationships and useful insights within datasets. This blog explores the important data mining techniques with practical examples, along with their applications, advantages and guidance on choosing a suitable approach.
At a Glance
1. Pattern Discovery: Data mining identifies useful relationships, trends and unusual patterns within datasets.2. Learning Approaches: Classification and regression commonly use labelled data, while clustering discovers groups without predefined categories.3. Specialised Methods: Text, graph, spatial and process mining examine different types of data and relationships.4. Practical Applications: Data mining supports activities such as customer analysis, fraud detection and operational planning.5. Technique Selection: The most suitable approach depends on the analytical goal, available data and how results will be evaluated.
You Looked at One Pair of Shoes. Now They're Everywhere!
You browse a pair of trainers during your lunch break. Later, similar products appear in your recommendations. The next day, you notice suggestions for matching accessories.
How did one small action lead to so many suggestions?
Digital platforms can use browsing activity, purchasing patterns and product relationships to personalise recommendations. Data mining techniques help identify useful patterns within this information, although different methods serve different analytical purposes. Let's find out how these techniques work and why choosing the right one matters.
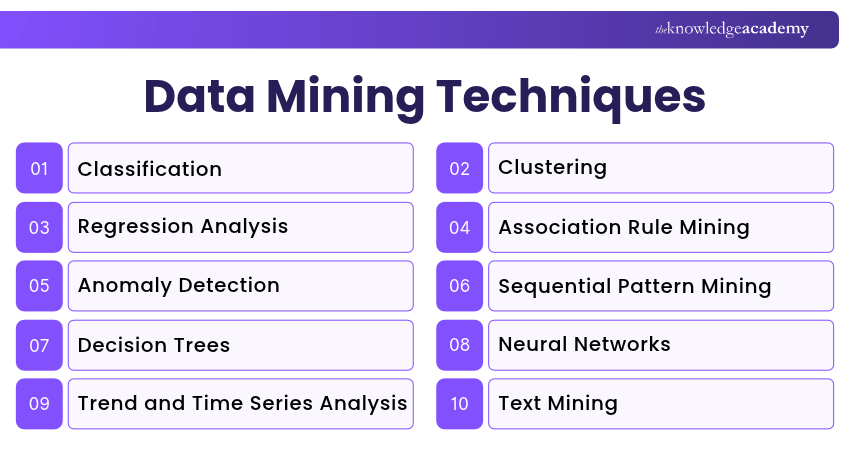
Top 15 Data Mining Techniques
Different data mining techniques serve different analytical purposes. Some identify patterns and relationships, while others support classification, prediction or specialised analysis. Several techniques can also be combined within the same project.
Here are the important techniques with practical examples:
1) Classification
Classification is a supervised machine learning technique that assigns data to predefined categories based on patterns learned from labelled examples. It is useful when the possible categories are known in advance.
Example: An email service analyses previously labelled messages to distinguish spam from legitimate emails. Once trained, the classification model predicts which category a new message belongs to.
Best Used For: Spam detection, document categorisation, customer churn classification and risk classification.

2) Clustering
Clustering groups data points according to their similarities without requiring predefined labels. It is an unsupervised learning technique that helps analysts discover groups or structures within datasets. Unlike classification, clustering does not begin with known categories for each record.
Example: An online retailer analyses customers based on purchase frequency, spending patterns and product preferences. Clustering may identify groups of occasional shoppers, frequent buyers and customers with similar interests.
Best Used For: Customer segmentation, exploratory data analysis and identifying groups with shared characteristics.
Pro Tip: Choose Your Features Carefully
Clustering results depend on the variables selected. Choose features that reflect your analytical objective, prepare them appropriately and check whether the resulting groups are meaningful before using them.
3) Regression Analysis
Regression analysis examines relationships between variables and can estimate numerical outcomes. It helps analysts understand how a target variable relates to one or more explanatory variables, using models that represent linear or more complex relationships.
Example: A retailer analyses historical sales, product prices and promotional expenditure to estimate future revenue. Regression can help examine relationships between these variables and generate numerical predictions, provided the model is appropriately validated and relevant forecasting assumptions are considered.
Best Used For: Revenue estimation, demand forecasting, cost analysis and investigating relationships between measurable variables.
Important
A statistical relationship does not automatically establish that one variable causes another.
4) Association Rule Mining
Association rule mining identifies relationships between items or events that frequently occur together. It is commonly used to understand purchasing patterns and other associations within transactional data. The technique generates rules describing how the occurrence of one item relates to another.
Example: A supermarket analyses shopping baskets and discovers that customers who purchase coffee frequently also purchase breakfast products. This finding may inform promotional planning or product recommendations.
Key Measures: Support, confidence and lift help analysts evaluate association rules.
Best Used For: Market basket analysis, product recommendations and discovering frequently associated events.
5) Anomaly Detection
Anomaly detection identifies observations that differ significantly from expected patterns. These unusual observations may indicate errors, security concerns, operational problems or rare but legitimate events. Statistical methods and machine learning models can both be used to identify anomalies.
Example: A bank identifies an unusually large transfer that differs from a customer's typical transaction activity. The transaction may be flagged for further investigation.
Best Used For: Fraud screening, network monitoring, quality assurance and unusual activity detection.
Trainer Insight: Anomaly Does Not Mean Fraud
An unusual transaction is not necessarily fraudulent. Anomaly detection helps prioritise investigations, but findings should be assessed using relevant evidence, business rules and human judgement.
6) Sequential Pattern Mining
Sequential pattern mining identifies recurring patterns in the order of events or actions. Unlike association rule mining, it considers the sequence in which activities occur. This makes it particularly useful for understanding behaviour across multiple steps.
Example: An e-commerce business analyses customer journeys and discovers a recurring sequence in which users compare products, add items to their baskets and then complete purchases.
Best Used For: Customer journey analysis, purchase sequence discovery and identifying recurring event patterns.
Turn complex data into clear decisions with the Decision Tree Modeling Using R Training – Join now!
7) Decision Trees
Decision trees generate predictions through a series of conditional splits based on input features. Depending on the task, their final nodes produce predicted categories or numerical values. They can support both classification and regression.
Example: A telecommunications provider uses a decision tree to classify customers according to whether they are likely to leave. The model may consider contract duration, service usage and previous complaints.
Best Used For: Classification, numerical prediction and applications requiring relatively interpretable models.
8) Neural Networks
Neural networks are machine learning models made up of interconnected computational units arranged in layers. During training, they adjust internal parameters to learn patterns and relationships from data. They are particularly useful for modelling complex relationships.
Example: A manufacturer uses images of finished products to train a neural network to identify possible surface defects. The model can then flag products requiring further inspection.
Best Used For: Image analysis, text processing, complex classification and predictive modelling.
Important
Neural networks may require substantial data and computing resources, and some models can be difficult to interpret.
9) Trend and Time Series Analysis
Trend and time series analysis examines observations recorded over time to identify long-term changes, seasonal patterns and other temporal relationships. Unlike general regression, time series methods explicitly consider the timing and ordering of observations.
Example: An electricity provider analyses hourly energy consumption to identify daily usage patterns and seasonal demand changes. These findings can support future capacity planning.
Best Used For: Demand planning, sales forecasting, financial analysis and operational performance monitoring.
10) Text Mining
Text mining extracts useful information from written language, including customer reviews, emails, survey responses and other text-based sources. It uses natural language processing, statistical methods and machine learning to identify topics, entities and meaningful patterns.
Example: A hotel chain analyses guest reviews to identify recurring comments about cleanliness, check-in delays and staff behaviour.
Best Used For: Customer feedback analysis, document processing and identifying themes in large text collections.
11) Dimensionality Reduction
Dimensionality reduction decreases the number of variables used to represent a dataset while retaining useful information. It can simplify complex data, support visual exploration and, in some cases, reduce computational requirements. However, the process may also result in information loss.
Example: A manufacturing company analyses hundreds of sensor measurements. Dimensionality reduction helps represent these measurements using fewer features, making the data easier to explore.
Best Used For: Data visualisation, exploratory analysis and feature reduction.
These methods have different purposes. PCA is commonly used for linear dimensionality reduction, while t-SNE and UMAP are frequently used for visualising complex structures. Also, their visual representations should be interpreted carefully, as apparent distances and clusters may not fully reflect the original data.
12) Ensemble learning
Ensemble learning combines multiple machine learning models to improve predictive performance and produce more reliable results. Instead of relying on a single model, it brings together predictions from several models. Common approaches include random forests and gradient boosting, which can support both classification and regression tasks.
Example: A subscription-based company analyses customer activity, engagement and payment history using a random forest model. By combining predictions from multiple decision trees, the company can estimate which customers are likely to cancel their subscriptions and investigate suitable retention strategies.
Best Used For: Customer churn prediction, fraud detection, risk assessment and improving classification or regression performance.
Learn predictive modelling techniques for data-driven insights with the Predictive Analytics Course – Sign up today!
13) Graph Mining
Graph mining examines relationships in data represented as interconnected nodes and edges. Nodes may represent people, accounts, products or locations, while edges describe connections or interactions between them.
Example: A financial institution examines relationships between bank accounts and payment transactions. Graph mining may reveal unusual transaction networks that require further investigation.
Best Used For: Fraud investigation, social network analysis and understanding interconnected systems.
14) Spatial Data Mining
Spatial data mining identifies patterns and relationships in geographically referenced data. It considers spatial characteristics such as location, distance, proximity and geographical distribution.
Example: A retail company analyses store locations, population distribution and purchasing activity to identify areas with potentially unmet customer demand.
Best Used For: Urban planning, environmental monitoring, location-based marketing and geographical risk analysis.
15) Process Mining
Process Mining examines event records from information systems to understand how business processes operate in practice. It can help organisations discover actual workflows, compare activities with expected processes and identify inefficiencies.
Example: A company analyses purchase order records from its enterprise resource planning system. Process mining identifies orders repeatedly moving between approval stages, causing delays, using records that capture individual orders, activities and their timestamps.
Best Used For: Workflow analysis, compliance monitoring, process bottleneck identification and operational improvement.
Process mining differs from general sequential analysis because it focuses specifically on understanding and evaluating business processes using event records.
How to Choose the Right Data Mining Technique
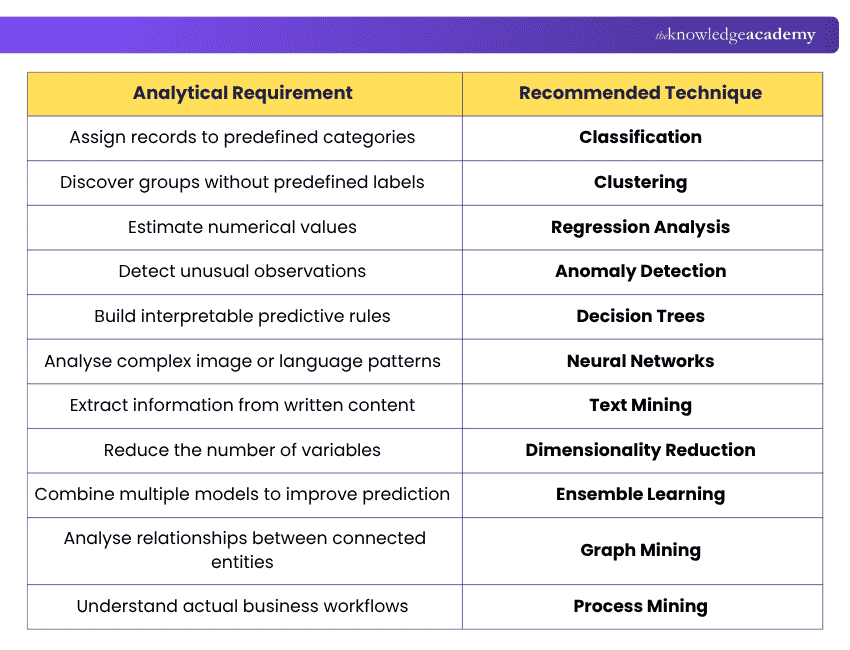
Choosing a data mining technique depends on what you want to discover, the type of data available and the results you need. The following table highlights suitable approaches for different analytical requirements. Let's look at it below:
Applications of Data Mining
Data mining is used across industries to identify patterns, analyse information and support specific activities. Different sectors apply these techniques according to their operational and analytical requirements. Here are the common applications of data mining across different industries:
1) Retail and E-commerce: Retailers use clustering and association rule mining to understand customer segments, identify purchasing patterns and support personalised product recommendations.
2) Finance and Banking: Financial institutions apply anomaly detection and graph mining to identify unusual transactions, examine account relationships and support fraud investigations.
3) Healthcare: Healthcare organisations use classification and regression analysis to examine patient outcomes, identify potential risk factors and support clinical research.
4) Manufacturing: Manufacturers apply time series analysis and neural networks to monitor equipment performance, identify potential defects and support predictive maintenance.
5) Marketing: Marketing teams use text mining and classification to analyse customer feedback, identify common concerns and estimate the likelihood of customer churn.
6) Logistics: Logistics companies use spatial data mining and process mining to examine delivery patterns, investigate workflow inefficiencies and support operational planning.
Practical Example: Combining Techniques in Retail
Imagine a retailer experiencing declining repeat purchases. The business could use several data mining techniques to investigate the situation:
1) Clustering: Group customers according to their purchasing behaviour and preferences.
2) Sequential Pattern Mining: Identify recurring sequences of customer actions associated with abandoned purchases.
3) Classification: Identify customers who may stop purchasing based on historical behaviour.
4) Association Rule Mining: Discover products frequently purchased together to explore potential recommendations.
Each technique provides a different perspective on the same business challenge. By combining their findings, the retailer can identify possible improvements, test suitable strategies and assess the results.
Learn practical R programming skills to analyse and visualise data with the Data Science With R Training – Register now!
Advantages of Data Mining
Data mining helps organisations uncover valuable insights from complex datasets, supporting better planning, analysis and decision-making. When applied using reliable data and suitable methods, it can offer several advantages. These are the key advantages of data mining:
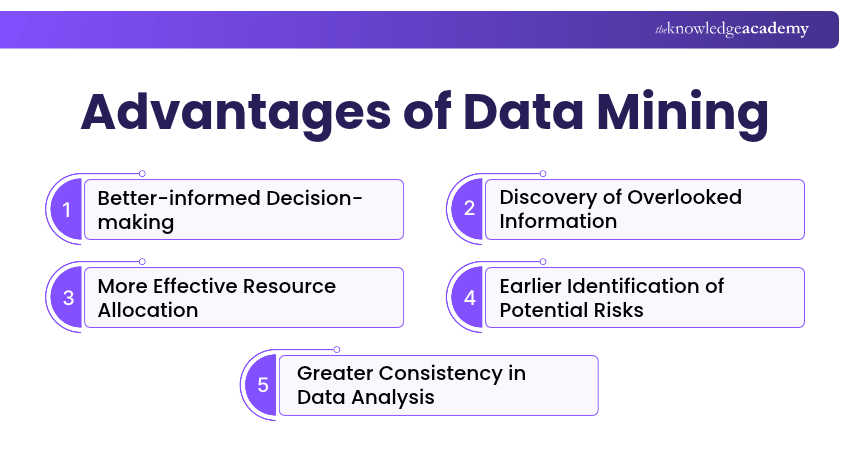
1) Better-informed Decision-making: Data mining provides evidence that can support decisions rather than relying solely on assumptions. By identifying relevant patterns and relationships, organisations can evaluate different options with a clearer understanding of the available information.
2) Discovery of Overlooked Information: Large datasets may contain relationships that are difficult to recognise through ordinary reporting. Data mining can reveal patterns that encourage further investigation and generate new questions for analysis.
3) More Effective Resource Allocation: Analysing operational information can help organisations identify where resources are being used inefficiently. These findings may support better planning and prioritisation, although improvements depend on the actions taken.
4) Earlier Identification of Potential Risks: Data mining can highlight unusual patterns, changes or emerging issues that warrant attention. This gives organisations an opportunity to investigate potential concerns before deciding whether intervention is necessary.
5) Greater Consistency in Data Analysis: Well-designed analytical methods can apply the same criteria across large numbers of records. This supports more systematic evaluation and can reduce reliance on inconsistent manual assessments.
Develop advanced analytical skills to extract meaningful insights from large datasets with the Data Science Courses – Join now!

Vishnu Sankar is a Senior Content Writer with 5+ years of experience across content development, software development, web development and system administration. His technical background and professional training support his expertise in IT and Tech, while his extensive research and writing experience covers Project Management and Health and Safety.
View Detail

 If you wish to make any changes to your course, please


