


 Top Rated Course

We may not have the course you’re looking for. If you enquire or give us a call on 01344203999 and speak to our training experts, we may still be able to help with your training requirements.
Top Excel Skills Every Expert Needs to Know
The Knowledge Academy 26 August 2026Develop essential Excel skills, from formulas and functions to PivotTables, Power Query, and VBA. Learn how these tools help organise, analyse, visualise, and automate data efficiently.

Training Outcomes Within Your Budget!
We ensure quality, budget-alignment, and timely delivery by our expert instructors.
Table of Contents
Having Excel doesn't make you an Excel expert. Knowing exactly what to do when the spreadsheet gets complicated does.
An expert sees messy data and thinks Power Query. Thousands of records? PivotTable. A tricky lookup? INDEX + MATCH. Repetitive work? VBA.
The real skill isn't memorising every Excel feature. It's knowing which one solves the problem in front of you.
Key Takeaways
1. Excel skills help professionals organise, analyse, visualise, and manage data efficiently2. Functions such as COUNTIFS, SUMIF, IFERROR, and INDEX + MATCH simplify data analysis3. PivotTables and Charts help transform large datasets into clear, actionable insights4. Power Query, Power Pivot, and VBA support advanced data preparation, modelling, and automation5. Advanced Excel skills are valuable across careers in accounting, administration, finance, and data analysis
What do Advanced Excel Skills Mean?
Microsoft Excel is a widely used tool among students and professionals across various industries for generating reports and managing projects. As technology advances, organisations seek professionals with Advanced Excel Skills.
Gaining expertise and certification in Advanced Excel increases your demand across sectors like financial services, administration, marketing, data analysis, inventory management, and market research. As part of mastering this skill, learning how to Create a Dashboard in Excel can further enhance your ability to analyse and present data effectively, making you an even more valuable asset in these fields.

Quick Recap
9:00 AM5,000 messy sales rows arrive→ Filters + Sorting9:15 AMNames need cleaning→ Flash Fill9:30 AM“How many orders exceeded target?”→ COUNTIFS10:00 AMManagement needs a summary→ PivotTable10:30 AMThey want trends→ Charts11:00 AM“This report is needed every Monday.”→ VBABottom:FROM RAW DATA AT 9:00 → REPEATABLE REPORT BY 11:00
What Are the Top Excel Skills for Professionals?
Whether you're a data analyst, marketer, or business professional, mastering the basic Excel Skills can dramatically improve your efficiency and decision-making. Below are the top Excel features every professional should know to work smarter and get more done with less effort.
1) Data Filters
Data Filters allow users to display only rows that meet specific criteria, hiding irrelevant data. This feature is essential for analysing large datasets efficiently, enabling users to focus on subsets of data without altering the original structure or content.
2) Data Sorting
Sorting is used to organise data in excel in a logical order either ascending or descending, based on the chosen column. It is easy to sort out text, numbers, or dates in order to identify trends and insights. By structuring data this way, users can interpret patterns more clearly and make well-informed decisions.
3) at reaches
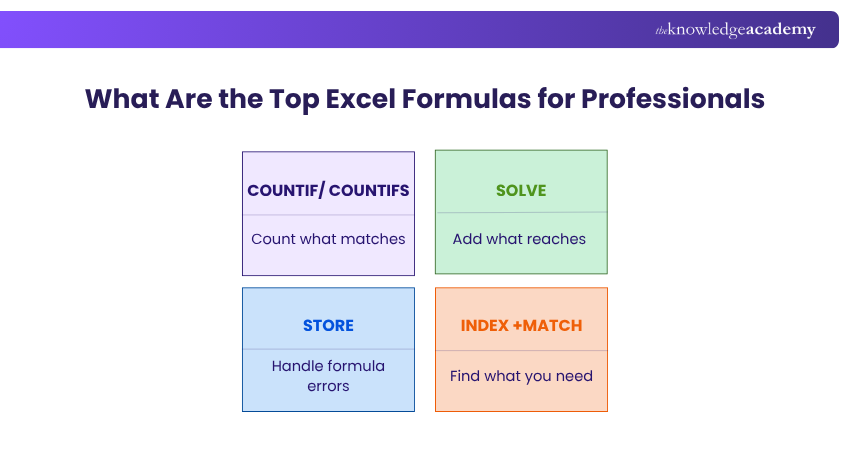
A simple method of analysing trends in your data would be to use COUNTIF in Excel, which allows you to count the number of cells within a range that meet one condition, e.g. values over a specific number, etc. COUNTIFS builds upon this, letting you filter by a number of different criteria in one or more ranges--such as including or excluding entries based on both category and date--so you can more intuitively draw conclusions without complex hand calculations.
4) Shortcut Keys
Excel shortcut keys improve efficiency by allowing users to perform frequent tasks quickly without using the mouse. From basic actions like copying and pasting to advanced navigation and formatting, mastering shortcuts significantly speeds up workflow and reduces repetitive strain.
5) Flash Fill
Flash Fill automatically detects patterns in data entry and completes the remaining cells accordingly. It’s especially useful for formatting names, splitting or combining text, and cleaning data, eliminating the need for complex formulas or manual input in repetitive tasks.
Excel in data automation through Microsoft Excel VBA and Macro Training- Join today!
6) PivotTables
PivotTables in the excel sheet are a powerful tool that assists you in summarising, filtering and reporting large volumes of data within a short period of time without distorting the original dataset. They simplify the process of grouping and comparing values by organising information into interactive views to enable a clear and structured presentation of insights to managers or other senior colleagues.
7) Charts
Charts transform raw data into visual representations like bar graphs, pie charts, and line graphs. They help users identify trends, compare values, and communicate insights clearly. Excel’s charting tools support customisation for better storytelling and data-driven presentations.
8) SUMIF
The SUMIF function in Excel totals only the values that satisfy a given condition, such as adding sales for a specific region or product category. By automatically calculating conditional sums, it helps you analyse data more efficiently and make informed decisions without manual effort
9) Conditional Formatting
Conditional Formatting changes the appearance of cells based on rules or conditions. It highlights important data, trends, or anomalies using colours, icons, or data bars, making spreadsheets more visually intuitive and helping users quickly interpret key information.
10) IFERROR
IFERROR allows users to replace formula errors with a specified value or message. Instead of displaying errors such as #DIV/0! or #N/A, spreadsheets can present cleaner and more meaningful results, improving readability and usability.
11) Index Match
INDEX MATCH is a flexible and powerful alternative to VLOOKUP. MATCH finds the position of a value, and INDEX retrieves the value at that position. Together, they allow for dynamic, accurate lookups across rows and columns in large datasets
12) Power Query
Power Query helps users connect to, import, clean, transform, and combine data from different sources. Its transformation steps can be refreshed when source data changes, making it particularly useful for repeatable data preparation workflows.
13) Power Pivot and Data Models
Power Pivot extends Excel's analytical capabilities by allowing users to create data models containing related tables. Users can establish relationships between tables and create calculations using Data Analysis Expressions (DAX), supporting more sophisticated analysis than a standard PivotTable alone.
14) Macros in Excel VBA
Macros automate repetitive tasks using Excel’s built-in programming language, Visual Basic for Applications (VBA). Users can record actions or write custom scripts to streamline workflows, reduce manual effort, and enhance productivity in complex or frequently updated spreadsheets.
Transform data into data-driven strategies- kickstart your Business Analytics with Excel Course today.
15) What-If Analysis, Goal Seek and Solver
Excel provides advanced analytical tools for exploring different scenarios and solving decision problems. What-If Analysis can compare possible outcomes, Goal Seek determines the input required to achieve a specified result, and Solver can find an optimal solution subject to defined variables and constraints.
The following are some key advanced skills that help elevate Excel proficiency and productivity:
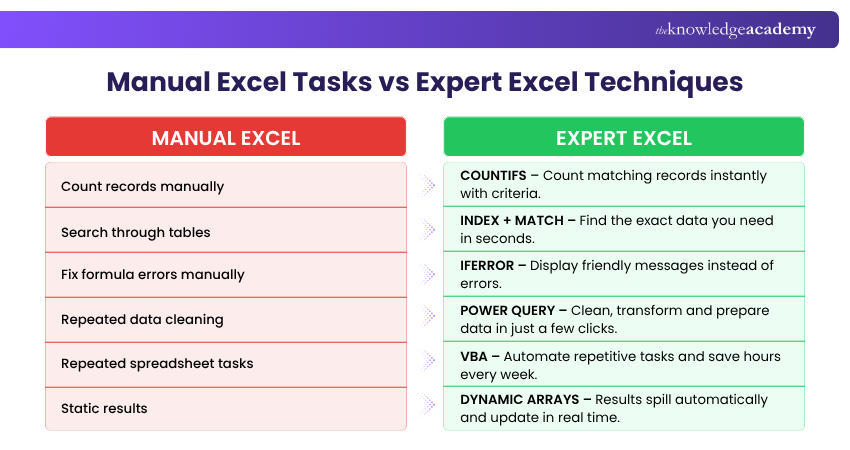
Pro Trainer Tip: Don't use a complex formula simply because you can. For repeatable data cleaning, summarisation, or modelling, tools such as Power Query, PivotTables, or Power Pivot may provide a more manageable approach.
5) Dynamic Arrays
Dynamic array formulas can return multiple results from a single formula and automatically spill them into neighbouring cells. Functions such as FILTER, SORT, and UNIQUE make it easier to create flexible calculations and dynamically update results.
What Jobs Will Require Advanced Excel Skills?
Microsoft Excel is used in most industries, but a few jobs and professions demand higher skills and knowledge in Excel. The level of the knowledge needed might vary from job to job. Following is a list of a few jobs which might require Advanced Excel Skills the most:
1) Accountant
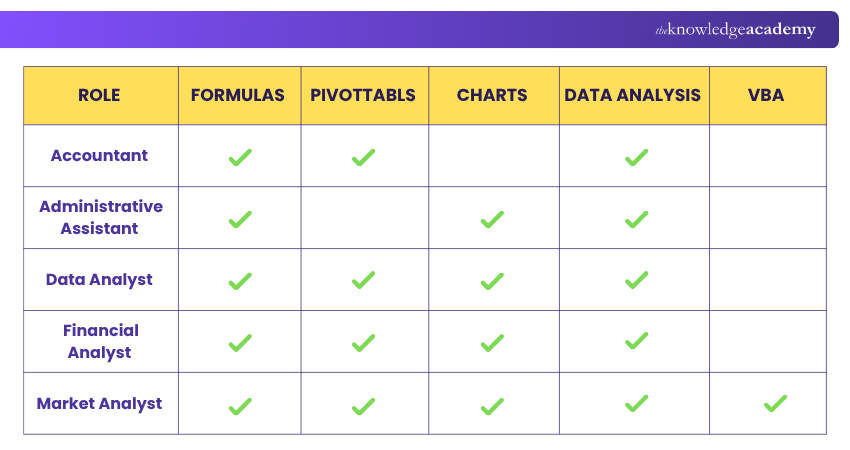
Accountants create, organise, and analyse financial documents and statements to ensure that they are accurate and updated. Accountants must be very good in Excel, be proficient in applying the formulas, formatting, and have a clear understanding of auditing functions to derive useful insights. Excel Formulas for Accounting allow them to customise Excel formulas and functions to determine budgets and profit margins and make calculations.
2) Administrative Assistant
The crucial role of an Administrative Assistant is to ensure that the operations and functionality of an organisation run smoothly. The tasks in this profession include bookkeeping, maintaining records, and organising documents, which require advanced Excel or intermediate-level skills at the minimum. It is critical for Administrative Assistants to have adequate knowledge of spreadsheets and data management to effectively handle the various departments, customers, and vendors.
3) Data Analyst
The goal of a Data Analyst is to create a meaningful narrative out of the collected data. A Data Analyst can help organisations make better-informed decisions by analysing and presenting the raw data as useful information. Even future predictions of demand, organisational growth or productivity can be conferred by analysing and identifying the different data trends.
PivotTables, INDEX MATCH functions, charts and forecasts, and trending tools are a few Advanced Excel Skills a Data Analyst needs. For example, if you are good at building charts, you can easily organise data into a simplified readable format, making it easier to extract insights for the users. The charts and graphs illustrated in an Excel sheet can make it more understandable, user-friendly, and readable.
4) Financial Analyst
Financial Analysts are essential team members responsible for tracking and maintaining an organisation’s financial performance through forecasts and reports based on market and business analysis.
They utilise Excel for risk analysis, budgeting, and cash flow tracking, leveraging features like formatting, data manipulation, PivotTables, and valuation equations. These same features can also be used for managing contact data imported from other formats, such as when you Convert VCF to Excel. With high demand and attractive salaries, advancing your Excel skills can secure your position and enhance salary negotiations.
5) Market Analyst
A Market Analyst uses Data Analytics to derive insights from raw data, aiding organisations in making informed decisions. They conduct market analysis to identify problems and opportunities for business expansion, involving data collection and evaluation.
Market analysts need Advanced Excel Skills, including PivotTables, Conditional Formatting, and VBA. These tools help analyse large data sets and improve data visualisation for clearer presentations.
Tick everything you can confidently do:
□ Filter and sort datasets□ Write conditional formulas□ Build PivotTables□ Clean data using Power Query□ Create data models in Power Pivot□ Automate tasks using VBA1–2 → Building the Basics3–4 → Proficient5–6 → Advanced
Conclusion
Excel becomes much more than a spreadsheet when you know how to use the right tools. From organising messy data to uncovering insights and automating repetitive work, the right Excel skills can turn rows and columns into smarter decisions. The more these skills develop, the more efficiently you can turn data into meaningful results.
Streamline your project visualisation with our Excel Training with Gantt Charts - Register today!
Frequently Asked Questions
How to List Excel Skills on a Resume?

There are various ways of displaying your Excel experience on your resume. You can list “Excel”, “Advanced Excel”, or “Intermediate Excel” in your skill section. Include Excel in your work history section, detailing how you specifically used Excel in a previous role or project.
What is the Potential Time-saving Shortcuts and Techniques in Excel for Busy Professionals?
Busy professionals can save time in Excel by utilising shortcuts like Ctrl+C/Ctrl+V for copy-pasting, Ctrl+Z for undo, Ctrl+S for saving. Techniques such as AutoFill, Flash Fill, and customising ribbon tabs, enhance efficiency in data manipulation and report generation.
How to Explain Excel Skills in an Interview?
When explaining basic Excel Skills in an interview, you must highlight your proficiency with tools like PivotTables, VLOOKUP, or VBA Macros. You should also mention practical applications, which can range from analysing large datasets to creating detailed financial reports.
What Jobs Can You Get with Excel Skills?
Excel Skills can help to pursue roles like Data Analyst, Financial Analyst, Accountant, Project Manager, and HR Specialist. These jobs often require tasks like analysing data, creating financial models, and managing reports. By gaining proficiency in this vital MS Office application, you can add value across industries.

The Knowledge Academy


Global Training Provider
The Knowledge Academy is a world-leading provider of professional training courses, offering globally recognised qualifications across a wide range of subjects. With expert trainers, up-to-date course material, and flexible learning options, we aim to empower professionals and organisations to achieve their goals through continuous learning.


 If you wish to make any changes to your course, please


