

 Top Rated Course

We may not have the course you’re looking for. If you enquire or give us a call on 01344203999 and speak to our training experts, we may still be able to help with your training requirements.
Top 50+ MATLAB Interview Questions and Answers
Eliza Taylor 19 December 2024This blog will include some important MATLAB Interview Questions which can aid you during your future interviews if you choose to become a MATLAB professional.
Training Outcomes Within Your Budget!
We ensure quality, budget-alignment, and timely delivery by our expert instructors.
Table of Contents

MATLAB is a software environment developed by MathWorks intended for high-performance numerical computing. It is used as a tool to conduct highly optimised calculations leading to interactive data-driven visualisations. It is also a popular tool in engineering and scientific research. The proficiency in MATLAB is often tested in MATLAB Interview Questions for jobs requiring numerical computation and data visualisation skills.
MATLAB has emerged as atop enterprise engineering platform for deploying AI models and has empowered developers with limited experience to widen their horizons. If you are interested in learning more, check out these top 45 MATLAB Interview Questions and Answers. Let's prepare these interview questions to crack your interview. Read further to learn more!
Table of Contents
1) MATLAB Interview Questions and Answers
a) Explain the MATLAB API.
b) What is the MATLAB working environment?
c) What is Simulink?
d) How can you plot a graph in MATLAB?
e) How can you call a function in MATLAB?
f) How can you run code in MATLAB?
g) How can you read .csv files in MATLAB?
h) What are some tools available in MATLAB?
i) How can you implement neural networks in MATLAB?
j) How can a Graphical User Interface (GUI) be created in MATLAB?
2) Conclusion
MATLAB Interview Questions and Answers
Here is a curated list of the most important interview questions and answers for your MATLAB preparation:
Explain the MATLAB API.
The MATLAB API also referred to as the Application Program Interface, provides developers to run their applications written in C and Fortran from within the software environment. The interface offers the user the facility for calling routines from within MATLAB and for writing Mat files. These functionalities make the software tool a computational engine.
What is the MATLAB working environment?
The working environment of MATLAB contains a collection of tools that developers can work with as a client or a programmer. The environment is comprised of components to facilitate the management of variables within the workspace. Additionally, users can also import and export data and take benefit of the tools for the development and debugging of Matlab files.
What is Simulink?
Simulink is an environment within MATLAB that is utilised to design various systems with multi-domain models. It also facilitates the simulation of the model before developers move to hardware. Developers can also deploy the systems without writing any code. Simulink assists developers from the stage of conceptualisation to operation by providing virtual models, validating designs, direct deployment and digital thread management.

How can you plot a graph in MATLAB?
Users can plot a simple graph for any two points, such as ‘X’ and ‘Y’. Two values can be taken as input into a function known as a plot(x,y). The plot() function is used to print the graph in MATLAB.
Syntax of the plot() function:
x : [value of array];
Y: [value of array];
Plot(x,y)
How can you call a function in MATLAB?
You can call a function in MATLAB by using the name that you have assigned to the function. You will need to write the name in the ‘New Script’ tab under the ‘File’ tab. You can then call the function by writing its name in the area designated for the code.
Syntax to call a function: “function_name”
How can you run code in MATLAB?
You need to first save your written code to update your progress to the assigned workspace directory. Then click on the ‘Save and Run’ button under the ‘Home’ tab of MATLAB. You can alternatively press F5 on your keyboard.
How can you read .csv files in MATLAB?
CSV, also known as ‘Comma-Separated Values’ is an extension for files that can be called in MATLAB by using the ‘csvread’ command.
Syntax for reading a .csv file is: X = csvread(filename)
The latest version of MATLAB provides a new command to read .csv files, that is, ‘readmatrix’.
New syntax for reading a .csv file is M = readmatrix(filename)
What are some tools available in MATLAB?

Some important tools available in MATLAB are as follows:
1) Neural Networks
2) System Identification
3) Robust Control
4) Fuzzy logic
5) LMI (Linear Matrix Inequalities) Control
6) Image Processing
How can you implement neural networks in MATLAB?
Neural networks (NN) are essentially systems that adapt by learning through the use of interconnected nodes or neurons. These nodes or neurons form a layered structure that resembles the human brain. The neural network has the capability to learn from data, and then it is trained to identify patterns. It can then classify data and predict future events.
Another feature of neural networks is that they break down the input into multiple layers of abstraction. The network can then be trained by feeding it various examples to identify patterns in speech or image information, like the human brain’s function. The behaviour of the neural network is defined by the interconnection of its individual elements. Moreover, the strength or weights of these connections also define the network.
Here is a step-by-step process to design a basic neural network in MATLAB:
1) Collect necessary data
2) Create a network
3) Configure the network
4) Initialise the values of weights and biases
5) Train the network
6) Validate the network
7) Utilise the network
Neural networks are utilised for tasks such as regression, classification and clustering. Once the networks are created, MATLAB can help you automatically generate the code required to capture the work and perform task automation.
Learn the fundamentals of deep learning and neural networks. Sign up for the Neural Networks with Deep Learning Training course now.
How can a GUI (Graphical User Interface) be created in MATLAB?
Users can create their own GUIs in MATLAB to include more control in their software applications. The presence of a GUI eliminates the efforts to input commands for running the application.
Here is the step-by-step process to create a GUI in MATLAB:
1) Start the GUIDE function by typing ‘guide’ in the MATLAB prompt
2) After the GUIDE quick start dialogue box opens, click on the ‘Blank GUI (Default)’ template and then click ‘OK’.
3) Display the component names in the component palette
4) Go to File>Preferences>GUIDE
5) Click on ‘Show names’ under the Component palette.
6) Click on ‘OK’
How to add a toolbox in MATLAB?
You can add a new toolbox to your MATLAB workspace using the following steps:
1) Go to the ‘Environment’ section under the ‘Home’ tab.
2) Select ‘Package Toolbox’ from the Add-Ons menu.
3) Once the ‘Package Toolbox’ dialogue box opens, click on the ‘plus’ button and choose your folder for the toolbox.
4) The path settings for your toolbox files and folders will be stored in a ‘.mltbx’ toolbox file.
5) In the same dialogue box, enter your toolbox information like its name, version, author name, company, email, the toolbox summary and description.
6) You can now save your toolbox by clicking on ‘Package’ located at the top of the ‘Package Toolbox’ dialogue box. MATLAB automatically generates a ‘.mltbx’ file in your assigned MATLAB folder once your toolbox is packaged.
What are the elements for 3D Visualisation in MATLAB?
MATLAB provides 3D visualisation elements for handling 3D graphics. Here are a few of the 3D visualisation elements offered by MATLAB:
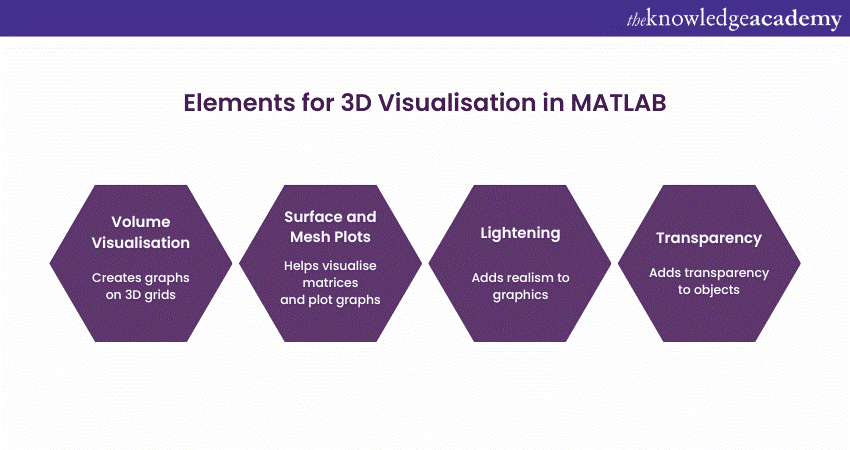
1) Surface and mesh plots: Surface plots help users visualise matrices whose size exceeds the limit for displaying numerical forms. These plots are also intended for plotting function graphs of two variables. Mesh plots are 3D surfaces comprising solid edge colours.
2) Lightening: A technique by MATLAB to add realism to a graphical scene. In lightening, the highlights and dark areas are simulated to imitate the occurrence of objects in natural lighting. A graphics object named ‘light’ is defined by the environment that then applies lighting to both surface and patch objects.
3) Transparency: This functionality adds transparency to objects present in the graph’s axes. It also specifies the value of the object’s transparency.
4) Volume visualisation: This functionality refers to the creation of graphical representations of data defined on 3-dimensional grids. These data sets are generally distinguishable by multi-dimensional arrays containing scalar or vector data.
What are the functions of memory management in MATLAB?
MATLAB provides five types of functions for memory management which are:
1) Clear: This function cleans the variables from memory.
2) Pack: The existing variables of the program are saved to disk using this function and then reloaded continuously.
3) Save: This function saves variables to the disk.
4) Load: This function reloads a file stored on a disk with the ‘save’ function.
5) Quit: This function closes the MATLAB software and reallocates all the memory back to the system.
What is Stress Analysis in MATLAB?
Stress Analysis, also known as ‘Finite Element Analysis’, is a computational technique in MATLAB utilised to predict how an object would react to real world forces like heat and vibrations.
It is a well-known method for solving common partial differential equations that are used in many engineering applications. The process of Stress Analysis involves the creation of geometry and definition of the problem via load, boundary and initial conditions.
What are the basic plots and graphs you can create in MATLAB?
The following list describes the plots and graphs that a user can create:
1) Error bar: The error bars are plotted along the curve.
2) Hold: The current graph is retained during the addition of a new graph
3) Line: A line object is created.
4) LineSpec: This is the syntax of the Line Specification String.
5) Plot: Creates a 2D Line Plot.
6) Plot3: Creates a 3D Line Plot.
7) Polar: Creates a plot with polar coordinates.
8) Subplot: Creates a graphical axis in tiled positions.
9) Xlim: Performs queries on the x-axis limits.
10) Ylim: Performs queries on the y-axis limits.
11) Zlim: Performs queries on the z-xis limits.
What are the components of MATLAB?
The MATLAB environment consists of the following components:
1) MATLAB language
2) MATLAB working environment
3) MATLAB graphics
4) MATLAB function library
5) MATLAB application program interface
What are the operators allowed in MATLAB?
MATLAB allows users to apply the following operators:
|
Operator |
Symbol |
Meaning |
|
Logical Operators |
& |
(Logical AND) |
|
|
| |
(Logical OR) |
|
|
&& |
(Logical AND with short-circuiting) |
|
|
|| |
(Logical OR with short-circuiting) |
|
|
~ |
(Logical NOT) |
|
Arithmetic Operators |
+ |
Addition |
|
|
- |
Subtraction |
|
|
* |
Matrix multiplication |
|
|
/ |
Matrix right division |
|
|
.* |
Element-wise multiplication |
|
Relational Operators |
== |
Equal to |
|
|
~= |
Not equal to |
|
|
> |
Greater than |
|
|
>= |
Greater than or equal to |
|
|
< |
Less than |
|
|
<= |
Less than or equal to |
What are some common toolboxes available in MATLAB?
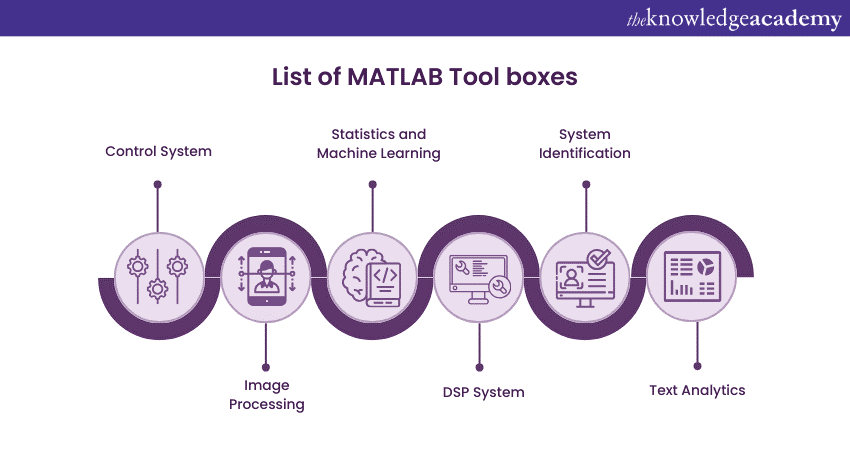
MATLAB contains the following toolboxes, among many others:
1) Control System: This toolbox helps users analyse, design and tune linear control systems by providing algorithms and applications.
2) Image Processing: This toolbox helps users to automate their image processing workflows. Users can also segment their image data and process large datasets in batches.
3) Statistics and Machine Learning: This toolbox helps users to describe, analyse and model their data. For example, they can utilise descriptive statistics for data analysis and fitting probability distributions to their data.
4) DSP System: This toolbox helps users to design, simulate and analyse their signal processing systems. They can also model DSP systems in real-time for audio, IoT and various other applications.
5) System Identification: This toolbox helps users work on various projects such as time-series analysis, dynamic system modelling and forecasting. The toolbox also allows users to conduct grey-box system identification to estimate the parameters of any user-defined model.
6) Text Analytics: This toolbox helps users to pre-process, analyse and model their textual data. The models created can be utilised for projects like sentiment analysis and predictive maintenance.
How can you use Simulink in MATLAB?
Users can utilise Simulink to create models for any process. This process can be a simulation of a bouncing ball or a hydraulic pump system. If users combine their use of MATLAB and Simulink, they will benefit from both textual and graphical programming for designing their system in a simulated environment. The MATLAB environment is designed to give users access to Simulink from within the workspace under the ‘Home’ tab.
Users can utilise Simulink as a graphical block programming tool with customised block libraries. Upon access, Simulink opens in the Library Browser, which is intended for building simulation models. Simulink provides users with various libraries categorised based on various systems. It will display design blocks to users after they select each one, followed by the creation of new models through the toolbar in the Library Browser.
Simulink models are block diagrams whose elements can be added by the selection of appropriate elements. Users can choose their elements from the Library Browser and drag them into the Model window. They can also choose to copy the model elements into the window.
How can ARDUINO be interfaced with MATLAB?
Users can interface their ARDUINO hardware with MATLAB through the following steps:
1) Open MATLAB and select the ‘Add-Ons’ drop-down menu. In this menu, click on ‘Get Hardware Support Packages’. The package installer window will then open.
2) Click on ‘Install from the Internet’ and select ‘Next’.
3) All the packages available in MATLAB and Simulink will then be displayed to users. They can then choose the Arduino package category and all the packages within it.
4) The installer will then request users to log in to their MathWorks account. If the users do not have one, they can install one during the installation process. Users can then accept the license agreement in the next step and download the packages. MATLAB will then download and install the selected packages.
5) After the package installation is complete, users can connect their Arduino hardware to the computer and type the command in MATLAB’s command window: >> a = arduino()
6) After pressing Enter on the keyboard, MATLAB will attempt to communicate with your Arduino board. Successful communication will display the Arduino board’s properties to the user.
Learn to navigate the MATLAB interface and write scripts and functions. Sign up for the MATLAB Masterclass now.
How can an Support Vector Machine (SVM) be implemented in MATLAB?
A Support Vector Machine (SVM) in MATLAB is a supervised machine learning algorithm that developers can utilise for various classification problems such as signal processing in medical applications, Natural Language Processing (NLP) and image and speech recognition. The SVM algorithm is designed to separate the data points in one class from the points of another class as much as possible.
The support vectors in an SVM are the subset of the training observations that help in identifying the location of the separating hyperplane. The algorithm can be implemented in programs written for detecting anomalies using an outlier threshold on objects.
If data contains exactly two classes, an SVM can be used to classify the data by finding the best hyperplane that has the largest margin between the two classes. SVMs can typically be used to work on separable data, non-separable data and non-linear transformation with kernels. The classifier can be trained, tuned and used to classify new data.
How can audio files be read in MATLAB?
The syntax for reading audio files in MATLAB is of three kinds, depending on the information to be read by the user:
Reading the Sample Data and Sample Rate
[y,Fs] = audioread(filename)
The function ‘audioread’ is used to read the data from the file named ‘filename’. The sampled data is returned through the variable ‘y’ and the sample rate for the data through ‘Fs’.
Reading a selected range of audio samples
[y,Fs] = audioread(filename, samples)
The function ‘samples’ is a vector of the form [start, finish], where ‘start’ and ‘finish’ refer to the first and last samples to read. These values are positive scalar integers. The two values should be lesser than the number of audio samples.
Reading the sampled data in the data range of the ‘native’ or ‘double’ type.
[y,Fs] = audioread(__, datatype)
The format of the data read will be with normalised samples or else samples in the native format.
The variable ‘y’ typically contains the audio data in a matrix form ‘m by n’. The variable ‘m’ is the number of audio samples read, and ‘n’ is the number of audio channels. The default datatype of ‘y’ is double.
What types of loops are provided by MATLAB?
Similar to other programming languages, MATLAB provides three types of loops such as:
1) For loop: This loop is used to repeat a procedure a specified number of times.
The syntax is-
for index = values
statements
end
2) While loop: This loop is used to repeat itself when the condition is true.
The syntax is-
while expression
statements
end
The group of statements written in this loop at executed as long as the expression is proven true. A true event occurs when the result contains non-zero elements.
3) Nested loops: These loops are used to run one loop within another loop. The nested loop can run a fixed number of iterations of the inner loop and stop the outer loop upon satisfying a particular condition.
The syntax is-
for I = 1 : 3
for j = 1 : 3
fprintf(‘i=%d, j=%d/n’, I, j);
end
end
The outer loop iteratively runs the values of ‘i’ from 1 to 3, and the inner loop iteratively runs the values of ‘j’ from 1 to 3. The whole loop body prints the message that includes the values of ‘i’ and ‘j’.
How can a p-code in MATLAB be described?
P-codes are a method to secure MATLAB source codes so that others will not have access to them in any Matlab project A MATLAB file has the extension ‘.m’, whereas the extension of a p-code in MATLAB is ‘.p’. The p-code file is executed the same as the MATLAB source file. When a source file is p-coded in MATLAB, it is obfuscated to hide the original data, where the data becomes confusing to interpret.
Obfuscation turns files into proprietary formats and can be used with the ‘pcode’ function as follows:
pcode file1, file2,….
The above command generates the P-code files like ‘filename.p’.
pcode *.m
The above command converts all the source ‘.m’ files to P-code files.
How can polynomials be written in MATLAB?
Polynomials are mathematical equations containing one variable with non-negative integer components. The MATLAB environment expresses polynomials using numeric row vectors that contain the coefficients of the polynomial. The coefficients are typically ordered by descending power.
For example, a numeric vector with three-four elements can be expressed as:
P = [p3 p2 p1 p0];
This vector can be represented as a polynomial, such as:
p(x) = px3 + px2 + px + p
The vector can be written with example values as follows:
p = [1 –2 2];
What are MEX files in MATLAB?
A MEX file in MATLAB is a function used to call a C or C++ program or a Fortran routine. Short for ‘MATLAB Executable’, mex files can be called from the command line in MATLAB like built-in functions. This file type is to be carefully used only when required as it is time-consuming and low-level in nature. Users can build their written programs using the ‘mex’ command.
Learn to write functions and design classes with polymorphic behaviour. Sign up for the C++ Programming Training course now.
Can programs be run on MATLAB without graphics?
In the case of a slow internet connection, users can start MATLAB without any graphics involved by using either of the following commands:
“matlab -nodesktop –dodisplay”
What are the Get and Set functions in MATLAB?
Graphic objects in MATLAB implement interfaces based on ‘set’ and ‘get’ functions. These functions allow access to various properties on object arrays when a function is called. The getter functions are used to access features, and the setter functions are used for assigning properties to objects.
What is Latex in MATLAB?
Latex, referred to as ‘LaTeX’ is a system intended to prepare documents for publishing scientific documents. LaTeX allows users to write in plain text instead of formatted text in Microsoft Word.
LaTeX can be used to express symbols in MATLAB with the command: “chr = latex(S)”
How can the path be modified in MATLAB?
Users can modify the path in MATLAB using the ‘PathTool GUI’. They can also add more directories to the path from the command line. If users do not have permission to write for the command ‘pathdef.m’ then ‘pathrc’ can be written in a different file.
What are the benefits of using MATLAB?
MATLAB offers a multitude of benefits across various fields, making it a popular choice for researchers, engineers, scientists, and students alike. Here are some key advantages of MATLAB usage
a) Powerful toolbox: MATLAB’s pre-built functions and algorithms save time and effort in a variety of fields including signal processing, Machine Learning and control systems.
b) Numerical mastery: MATLAB handles calculations and large datasets very efficiently with its robust numerical and symbolic computational capabilities.
c) Visualisation capabilities: Matlab creates extensive graphs, animations and interactive visuals, both in 2D and 3D, to aid in data exploration and publication.
d) User friendly IDE: With its intuitive interface, extensive documentation and thorough debugging tools, MATLAB offers a smooth learning and development experience.
e) Thriving community: MATLAB’s large user base comprising both professionals and academics facilitates efficient learning, collaboration and problem solving.
How is vectorisation helpful in MATLAB?
Vectorisation is a concept that helps convert any matrix operations into ‘for’ and ‘while’ loops. Additionally, the algorithm also helps to speed up code execution.
For example, a vectorised code for computing the sine of 1001 values from 0 to 10 can be written as:
t = 0:.01:10;
y = sin(t);
How can MATLAB source code be protected?
Code written in MATLAB is saved with the ‘.m’ extension that is secured by default. However, users can secure their files more in the following ways:
1) Convert file into P-code: Converts the files into obscured content.
2) Compile file into binary format: Compiles with the MATLAB compiler to produce a standalone application.
How can differential equations be solved in MATLAB?

Users can solve differential equations in MATLAB by following a set of instructions and correct syntax. MATLAB provides users with ODE (Ordinary Differential Equation) solvers to tackle initial value problems.
Follow these steps to solve differential equations in MATLAB:
1) Create a new function in a .m file to define the equation’s right-hand side.
2) Determine the length of the interval for the independent variable.
3) Enter the initial condition as n0.
4) Call the ODE solver to produce the solution.
5) The output will be on the left-hand side of the command.
How can a program be stopped in MATLAB?
A program in MATLAB can be stopped by using the ‘quit’ command or the keyboard shortcut ‘Ctrl + C’.
How to plot a circle in MATLAB?
The MATLAB function ‘circle()’ with the values for radius ‘r’ and the centre coordinates ‘x’ and ‘y’, can be written as:
function a = circle(x,y,r)
The actual code can be run from the workspace by typing the function name ‘circle’ with the input conditions.
How can EXCEL data be imported into MATLAB?
A user can import data from Excel by clicking on the ‘Import Data’ button under the ‘Home’ tab and then selecting the Excel file to be imported.
How can a background be removed from an image in MATLAB?
The background of an image can be removed through colour-based segmentation using K-means Clustering:
1) Read the image using the ‘imread’ function.
2) Convert the image into L*a*b colour space from RGB colour.
3) Classify the colours using K-means Clustering.
How can a path be added in MATLAB?
The function ‘addpath’ adds a path in MATLAB and is written with the syntax: addpath(‘directory’)
or
addpath(‘dir’,’dir2’,’dir3’,…)
or
click ‘Set Path’ under File Menu
How can an array be declared in MATLAB?
A user can declare a MATLAB Array by using syntax in either of the ways:
1) B = [2 3 4 5 6]
2) X = [2,3,4,5,6]
How can sine waves be generated in MATLAB?
Sine waves can be generated using the sin() function, with the variables ‘w’ (frequency), ‘t’ (time) and ‘a’ (angular velocity). The variable values can be changed to generate sine waves of longer wavelengths.
How can commenting be done on multiple lines in MATLAB?
A user can comment on multiple lines with the following syntax:
%{
Comments
%}
What are handle graphics in MATLAB?
Handle graphics is a subsystem in MATLAB which handles graphics of any form. The subsystem helps visualise 2D and 3D data using high-level commands. Other tasks, such as animation and image processing, can be done using handle graphics. The appearance of graphics can be altered using low-level commands.
What is an M-file in MATLAB?
M-files are text files in MATLAB used for storing scripts, classes or individual functions. M-file is the basic file type in MATLAB.
What is the drawback of MATLAB?
A major drawback of MATLAB is its nature as an interpreted language, which makes it perform tasks slower than compiled languages.
How to resize an image in MATLAB?
There are multiple methods to resize an image in MATLAB. Here are the most employed ones:
Using the imresize function
This is the most versatile and widely used method. It allows users to indicate the desired size either directly or as a magnification factor, providing flexibility in the resizing process.
|
resizedImage = imresize(originalImage, [newHeight newWidth]); |
|
resizedImage = imresize(originalImage, magnificationFactor); |
Using imcrop function
You can crop a designated region from an image and subsequently resize it using this method.
|
croppedImage = imcrop(originalImage, [xStart yStart width height]); resizedImage = imresize(croppedImage, desiredSize); |
Using Graphical User Interface (GUI)
MATLAB offers the imresize GUI tool, enabling users to visually choose the desired size and cropping region for an image. This proves beneficial for interactive exploration, providing a user-friendly interface for precise adjustments during the resizing process.
How to correctly apply the Graphics Patches in MATLAB?
Follow these steps for proper application of Graphics Patches in MATLAB:
a) Generate a Patch Object: Utilise the patch function to craft a patch object with the desired shape and specifications. Define the patch's vertices by specifying x-y coordinates in a matrix. Optionally, include additional properties like FaceColor, EdgeColor, FaceVertexCData, etc.
b) Incorporate the Patch into a Figure: Use the add function to introduce the patch object into a figure. Specify the axes handle where you intend to showcase the patch.
c) Customise Appearance (Optional): Modify properties such as FaceColor, EdgeColor, LineWidth, MarkerSize, etc., to tailor the patch's visual presentation.
Example:
|
% Create a hexagon patch with defined vertices and color vertices = [10 10; 20 10; 30 20; 30 30; 20 40; 10 30]; patch('Vertices', vertices, 'FaceColor', 'green', 'EdgeColor', 'blue'); % Integrate it into the current figure axis equal; % Ensure an equal aspect ratio for accurate display |
How do you create a matrix in MATLAB?
In MATLAB, creating a matrix involves specifying its elements within square brackets, separating columns with spaces or commas, and rows with semicolons. For instance, to generate a 2x3 matrix:
|
matrix = [1, 2, 3; 4, 5, 6]; |
This command constructs a matrix with two rows and three columns. Alternatively, MATLAB provides functions like zeros, ones, and eye for creating matrices with specific properties. Using these MATLAB commands, users can efficiently initialise matrices filled with zeros, ones, or identity matrices, respectively, catering to diverse numerical computing requirements.
How to use for loop in MATLAB?
To use a for loop in MATLAB, follow this syntax:
|
for variable = start:step:end % Your code here end |
Define a loop variable (variable) with an initial value (start), a step size (step), and a final value (end).
The loop iterates from the initial to the final value, incrementing or decrementing by the specified step.
Insert your code within the loop to execute iteratively.
For example, to print numbers from 1 to 5:
|
for i = 1:5 disp(i); end |
This loop outputs numbers 1 through 5 in the MATLAB command window.
How do you use the eval function in MATLAB? What are some potential drawbacks of using it?
The eval function in MATLAB evaluates a string as a MATLAB expression, enabling dynamic execution of code. To use it, construct a string containing valid MATLAB code and pass it as an argument to eval. For instance:
|
expression = 'a + b'; result = eval(expression); |
However, the use of eval comes with potential drawbacks.
a) It can introduce security risks, as it allows the execution of arbitrary code, making scripts vulnerable to injection attacks.
b) Its usage can hinder code readability and maintenance since code within strings lacks the benefits of syntax highlighting and error checking.
Alternatives like function handles or inline functions are recommended for safer and more structured dynamic code execution in MATLAB, minimising potential security and maintainability issues associated with eval.
Explain the following, who, whos, pi, eps, type.
a) who: The who command displays a list of currently defined variables in the workspace, providing their names, sizes, and other relevant information. It helps users keep track of available variables during a session.
b) whos: Like who, whos provides detailed information about the variables in the workspace, including their names, sizes, data types, and memory usage. It offers a comprehensive overview for managing variables effectively.
c) pi: pi represents the mathematical constant pi (approximately 3.1416) in MATLAB. It is often used in mathematical calculations and trigonometric functions.
d) eps: eps stands for machine epsilon, representing the smallest positive floating-point number that MATLAB can represent. It is useful for handling numerical precision issues in computations.
e) type: The type command displays the contents of a specified file. It is commonly used to inspect script or function files within the MATLAB environment.
How to write functions in MATLAB?
In MATLAB, writing functions involves defining a separate file or script containing the function code. Follow these steps:
a) Create a new script or function file: Open the MATLAB Editor or any text editor to create a new file.
b) Define the function: Use the function keyword followed by the output variable(s) and the function name. For example:
|
function output = myFunction(input) |
c) Write the function code: Add the body of the function, including any computations or operations. Assign the output value(s) using the specified output variable(s).
d) Save the file: Save the file with the same name as the function, ensuring a .m extension.
e) Call the function: In the MATLAB Command Window, call the function with appropriate input values to execute the code.
For example, a simple function to square a number:
|
function result = squareNumber(x) result = x^2; end |
Save this as squareNumber.m and call it in the Command Window: squareResult = squareNumber(4); will set squareResult to 16.
 If you wish to make any changes to your course, please


