

 Top Rated Course

We may not have the course you’re looking for. If you enquire or give us a call on 01344203999 and speak to our training experts, we may still be able to help with your training requirements.
Top 40+ Data Analyst Interview Questions and Answers
Pearl Williams 02 February 2026A Data Analyst plays a key role in interpreting and analysing data to help businesses make decisions. This blog explores Data Analyst Interview Questions, covering topics such as general, technical, situational and behavioural. It includes questions on problem-solving and handling missing data, helping you prepare for your next interview.
Training Outcomes Within Your Budget!
We ensure quality, budget-alignment, and timely delivery by our expert instructors.
Table of Contents

Imagine you're getting ready for a Data Analyst interview, but you are unsure of the types of questions you will face. This blog walks you through the most common Data Analyst Interview Questions, organised into general, technical, behavioural, and situational categories.
Whether you are a beginner or an experienced analyst, these questions and answers will help you feel confident and prepared. From mastering SQL queries to handling tricky real-world data problems, this blog equips you with everything you need to ace your next Data Analyst interview.
Table of Contents
1) General Data Analyst Interview Questions and Answers
2) Technical Data Analyst Interview Questions and Answers
3) Behavioural Data Analyst Interview Questions and Answers
4) Situational Data Analyst Interview Questions and Answers
5) Conclusion
General Data Analyst Interview Questions and Answers
This section covers questions for beginners, focusing on foundational skills and the basic responsibilities of a Data Analyst.
Can you introduce yourself and give a brief background?
What interviewers want a concise introduction about your professional background, including your experience in Data Analysis. They also want to understand how your skills align with the role.
Sample Answer: “I have a background in Data Analysis, with 3 years of experience working in the finance sector. My work has focused on analysing large datasets, developing insights, and supporting decision-making processes. I am skilled in SQL, Python, and various data visualisation tools like Tableau. Additionally, I have a strong understanding of statistical methods, which I apply regularly in my analyses.”

What are the main responsibilities of a Data Analyst?
The interviewers are looking for your understanding of the core tasks that a Data Analyst performs daily.
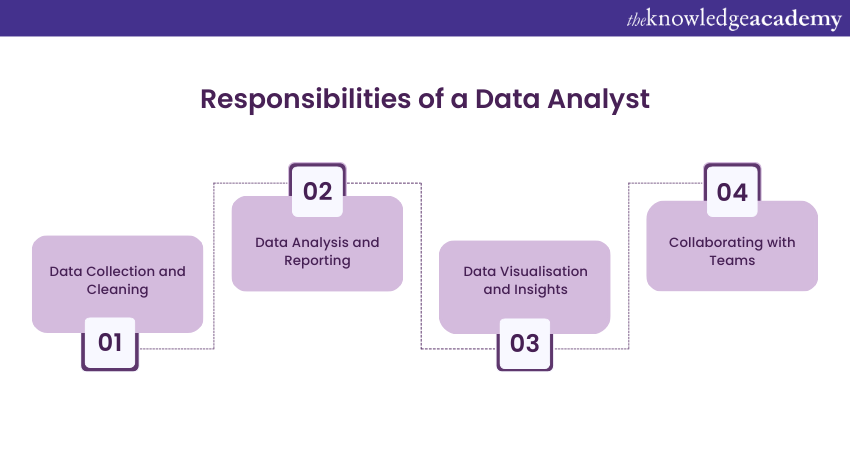
Sample Answer: “ Here are the key responsibilities of a Data Analyst
a) Collecting Data: Gather data from various sources.
b) Cleaning Data: Ensure data quality by cleaning and preprocessing.
c) Analysing Data: Perform data analysis to extract actionable insights.
d) Using Tools: Utilise various tools to generate reports and visualisations.
e) Providing Recommendations: Offer data-driven recommendations based on analysis.
f) Presenting Findings: Present findings in a clear and accessible manner to decision-makers.
g) Collaborating: Work with other departments to support data-driven strategies.”
How do Data Mining and Data Profiling differ?
The interviewers want to assess if you understand the key differences between these two important data processes.
Sample Answer: “Data Mining involves analysing large datasets to discover insights that can help predict trends or inform decision-making. It focuses on exploring new data relationships. On the other hand, Data Profiling is the process of reviewing existing data for quality, accuracy, and consistency, helping ensure that data is reliable for analysis.”
What is 'Data Wrangling' in the context of Data Analytics?
The interviewers want to know if you have any idea of how data is prepared for analysis.
Sample Answer: “Data Wrangling implies the act of preparing raw data to make it ready for analysis. This involves processes like removing duplicate, handling records with missing data, and placing records in a format that can be analysed. It is a critical step because data often needs to be cleaned and shaped to extract useful information from it.”
What are the key steps in an analytics project?
The interviewers are looking for your understanding of the general flow of an analytics project from start to finish.
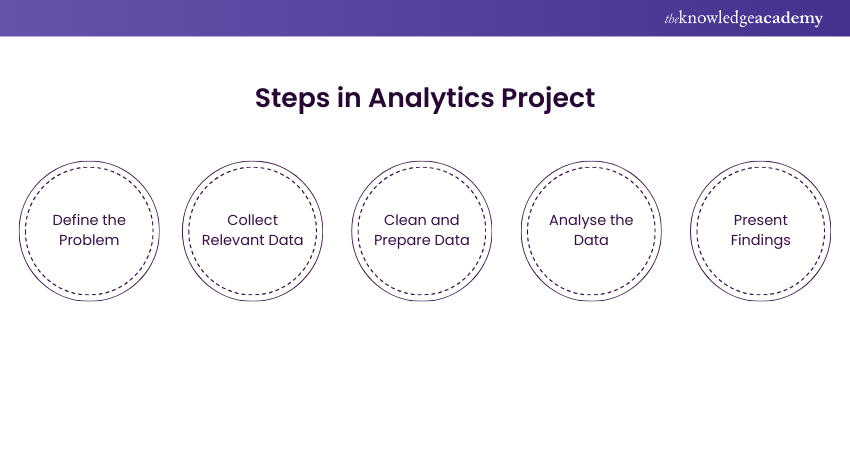
Sample Answer: “ Here are the key steps:
a) Define the Problem: Understand the business question.
b) Collect Data: Gather relevant data.
c) Clean and Prepare Data: Handle missing values and format data.
d) Analyse Data: Apply analytical techniques.
e) Interpret and Present Findings: Create reports or dashboards for stakeholders.”
What common challenges do Data Analysts face during their work?
The interviewers want to see if you are capable of preventing and solving common issues in Data Analysis.
Sample Answer: “One common problem is the way the data is often messy and needs lots of preprocessing work. Some works also have issues with the accuracy of the data because it is sometimes incorrect. Another issue is when it is difficult to explain Data Analysis to decision-makers who may not fully understand all the technical stuff.”
Which data visualisation tools have you worked with?
The interviewers want to know your familiarity with tools for creating visual reports and dashboards.
Sample Answer: “I have worked extensively with Tableau, Power BI, and Google Data Studio. These tools allow me to create visually appealing dashboards that help stakeholders easily interpret the data. I’m also proficient in using Python libraries like Matplotlib and Seaborn for more custom visualisations.”
What technical tools have you used for analysis and presenting findings?
The interviewers want to know your familiarity with tools for creating visual reports and dashboards.
Sample Answer: “I have worked extensively with Tableau, Power BI, and Google Data Studio. These tools allow me to create visually appealing dashboards that help stakeholders easily interpret the data. I’m also proficient in using Python libraries like Matplotlib and Seaborn for more custom visualisations.”
What are the most effective methods for cleaning data?
The interviewers are interested in whether you comprehend the significance of the quality of data as well as how to ensure it.
Sample Answer: “Some of the data cleaning processes include handling of missing values through either imputation or deletion, removal of any duplicate data or standardising the data formats. I also make sure that there are no outliers within the data since they can skew the results of an analysis. It is important since it makes sure that the analysis is done on accurate data.”
Why is Exploratory Data Analysis (EDA) important?
The interviewers want to know if you understand the significance of EDA in uncovering initial insights.
Sample Answer: “EDA is important because it helps us understand the structure of the data, identify patterns, and detect anomalies. It’s the first step in the analysis process, allowing us to summarise the data’s main characteristics. EDA also guides us in selecting the right models or methods for further analysis.”
Could you explain the differences between descriptive, predictive, and prescriptive analytics?
The interviewers are checking if you understand the different types of analytics and their purposes.

Technical Data Analyst Interview Questions and Answers
This section covers advanced questions that are perfect for experienced analysts, including SQL, database management, and technical tools.
What is SQL, and why is it important for Data Analysts?
The interviewers want to assess your understanding of SQL and how it's used to manage and analyse data in databases.
Sample Answer: “SQL or Structured Query Language is used to communicate with databases. For Data Analysts, SQL is crucial for querying, updating, and managing data stored in relational databases. It helps us retrieve specific data needed for analysis, and we can use it to filter, sort, and aggregate data. Without SQL, working efficiently with large datasets stored in databases would be difficult.”
Explain the differences between INNER JOIN and LEFT JOIN
The interviewers want to know if you can distinguish between different SQL joins and understand how to use them correctly.
Sample Answer: “An INNER JOIN retrieves records that have matching values in both tables. In contrast, a LEFT JOIN returns all records from the left table and only the matching records from the right table; if no match is found, it returns NULL for the right table. INNER JOIN is used when you only want matching records, while LEFT JOIN is useful when you want all records from one table, even if they don't match with the other table.”
How do you optimise an SQL query for better performance?
The interviewers want to see if you know how to make queries run faster and more efficiently.
Sample Answer: “To optimise an SQL query, I make sure to select only the necessary columns using SELECT rather than using SELECT *. I also use indexing to speed up searches on large tables, avoid complex subqueries and prefer JOINs over nested queries. Properly filtering data using WHERE conditions and reducing unnecessary operations also helps improve performance.”
Describe the process of normalising a database
The interviewers want to assess your knowledge of database design and how to avoid redundancy.
Sample Answer: “Database normalisation involves organising the database to reduce redundancy and improve data integrity. It’s done in several stages or forms, with the First Normal Form (1NF) removing duplicate data, the Second Normal Form (2NF) eliminating partial dependencies, and the Third Normal Form (3NF) removing transitive dependencies. This process makes the data more efficient to store and manage, reducing data anomalies.”
How would you clean and preprocess a dataset with missing values?
The interviewers want to know how you handle incomplete data and prepare it for analysis.
Sample Answer: “I would first assess how many and which values are missing, then decide the best method to handle them. For small amounts of missing data, I may remove the rows, but for larger gaps, I would use imputation techniques like replacing them with the mean or median. I could also use advanced methods like regression or Big Data Machine Learning models to predict the missing values. It's important to document how missing data is handled for transparency.”
What are outlier values, and how would you handle them during analysis?
The interviewers also wish to determine how you can identify such data that may distort the analysis results.
Sample Answer: “Outliers are data points that are much different from the rest of the data in the set. I always identify outliers using tools like box plots or calculating the value z-scores to acknowledge extremely different values. Depending on the circumstances, I might check if the outlier belongs to an error or a genuine value. If the outlier is an error or not, if it is an error, then the outlier is removed; if it is valid, it may be discarded, or techniques such as robust statistics may be applied.”
Demonstrate how to aggregate data using GROUP BY in SQL
The interviewers want to see if you can perform aggregation in SQL, which is a common task in Data Analysis.
Sample Answer: “To aggregate data, you can use GROUP BY to group records by a specific column and then apply aggregate functions like SUM, COUNT, AVG, etc. For example, to count the number of orders by customer, I could use:
|
SELECT customer_id, COUNT(order_id) |
This groups the orders by customer and shows how many orders each customer has made.”
Explain the concept of "tidy data" in the context of Data Analysis
The interviewers want to know if you understand the importance of data organisation for analysis.
Sample Answer: “Tidy data refers to data that is well-organised, making it easier to analyse. In tidy data, each row represents an observation, the column represents a variable, and the cell contains a single value. This structure simplifies the process of analysis because it aligns with most Data Analysis tools and methods, allowing for easier manipulation, visualisation, and understanding of the data.”
What is the Central Limit Theorem, and why is it important?
The interviewers want to test your knowledge of key statistical principles.
Sample Answer: “The Central Limit Theorem (CLT) states that when you take a large enough sample from any population, the average of the sample will approximate a normal distribution, even if the original data is not normally distributed. This is important because it helps us make predictions about the entire population using just sample data. With the CLT, we can use statistical methods like confidence intervals and hypothesis testing more effectively."
Differentiate between descriptive and inferential statistics
The interviewers want to ensure you understand the two types of statistical analysis.
Sample Answer: ““Descriptive statistics summarise the features of a dataset, such as the mean, median, and standard deviation. Inferential statistics use sample data to make predictions or inferences about a larger population. While descriptive statistics provide a snapshot of data, inferential statistics help us understand trends and patterns that may apply to the broader population.”
How do you calculate the mean, median, and mode of a dataset?
The interviewers want to assess your understanding of basic statistical measures.
Sample Answer: “The mean is found by adding all the data points together and dividing by the total number of points. The median is the middle value when the data is sorted in order. The mode is the value that occurs most often. These measures help us understand the central point or common values in a dataset."
Discuss the steps involved in hypothesis testing
The interviewers want to know your understanding of statistical testing methods.
Sample Answer: “The steps in hypothesis testing start with defining a null hypothesis (which assumes no effect or difference) and an alternative hypothesis (which suggests there is an effect or difference). Next, you choose a significance level (alpha), typically set at 0.05.
Then, you select an appropriate statistical test (like a t-test or chi-square test) and calculate the test statistic. You compare this statistic to a critical value to determine the outcome. If the test statistic is higher than the critical value, you reject the null hypothesis; otherwise, you fail to reject it.”
Why is data visualisation important in Data Analysis?
The interviewers want to assess your understanding of the value of clear data presentation.

Sample Answer: “Data visualisation helps to communicate complex data in a way that is easy to understand. It makes it possible to identify patterns, trends, and outliers quickly. Visuals like charts and graphs simplify the interpretation of data, helping stakeholders make informed decisions. Without effective visualisation, data insights may be lost or misunderstood.”
Compare and contrast different types of data visualisations (e.g., bar charts, scatter plots)
The interviewers want to see if you can choose the right type of visualisation for different data types.
Sample Answer: “Bar charts are ideal for comparing categories, while scatter plots are useful for showing the relationship between two continuous variables. Line charts are great for tracking changes over time. Each visualisation type has a specific purpose, and choosing the right one depends on the type of data and the story you want to tell.”
How can you create an effective data visualisation that conveys insights clearly?
The interviewers want to know your process for designing meaningful and clear visualisations.
Sample Answer: “To create effective visualisations, I focus on clarity and simplicity, avoiding unnecessary elements that could clutter the view. I ensure that the labels, titles, and axes are clearly marked, and I use colour and size to highlight important trends or data points. It’s important to choose the right chart type for the data and the audience. Lastly, I always test the visualisation with others to make sure it communicates the insights effectively.”
What is the purpose of using box plots, and how do you interpret them?
The interviewers want to know your ability to use and understand box plots, a common visualisation tool.

Sample Answer:” Box plots are used to show the distribution of a dataset and highlight any outliers. The box represents the Interquartile Range (IQR), which contains the middle 50% of the data, while the line inside the box marks the median. The "whiskers" extend to the smallest and largest values within 1.5 times the IQR, and any points outside the whiskers are outliers. Box plots help us quickly see the data's spread, central value, and any extreme values.”
How would you handle data duplication in a dataset?
The interviewers want to know if you can identify and deal with duplicate entries effectively.
Sample Answer: “I first identify duplicates by checking for identical rows or key variables that shouldn't repeat. After identifying duplicates, I determine if they are errors or legitimate entries. If they are errors, I remove them to ensure the dataset is accurate. This process helps avoid skewed results caused by duplicate data.”
What is correlation, and how do you interpret correlation coefficients?
The interviewers want to assess your understanding of how variables relate to each other.
Sample Answer: “Correlation measures how two variables move in relation to each other. The correlation coefficient ranges from -1 to 1. A value of 1 means the two variables have a strong positive relationship (as one increases, the other does too), while -1 means a strong negative relationship (as one increases, the other decreases). A value of 0 means there’s no relationship between the two variables.”
When would you use a bar chart over a line chart in data visualisation?
The interviewers want to know if you know how to choose the right chart for the data.
Sample Answer: “I would use a bar chart when I want to compare different categories or groups. Bar charts are effective for showing the size of each category, making it easy to compare across them. A line chart, on the other hand, is more suited for showing trends over time or continuous data.”
Describe the steps you would take to present complex Data Analysis findings to a non-technical audience.
The interviewers want to assess your communication skills and ability to simplify complex data.
Sample Answer: “First, I identify the key insights that are most relevant to the audience. Then, I use simple language, avoiding technical jargon, and I rely on clear visuals to illustrate the data. I ensure that I explain how the findings impact their business or objectives. Finally, I invite questions to make sure the audience fully understands the conclusions.”
Behavioural Data Analyst Interview Questions and Answers
This section includes questions aimed at understanding how candidates handle workplace scenarios, which is ideal for both beginners and experienced professionals.
Describe a challenging Data Analysis problem you have encountered and how you resolved it
The interviewers want to understand how you handle difficult situations and your approach to problem-solving.
Sample Answer: “I was working on a project where the dataset had a lot of missing and inconsistent values. To resolve this, I first cleaned the data by removing duplicates and using imputation techniques to fill missing values. Then, I applied statistical analysis to identify patterns in the cleaned data. I communicated the challenges and solutions to my team, and we successfully used the cleaned dataset for meaningful insights.”
How do you approach a problem when you don't have all the necessary data?
The interviewers want to assess how you handle uncertainty and make decisions with incomplete information.
Sample Answer: “When I don’t have all the data, I first analyse what is available and identify gaps. I try to gather more data from relevant sources or reach out to stakeholders for clarification. If that’s not possible, I use assumptions based on trends or similar datasets, and I clearly communicate these assumptions to the team. This ensures transparency in the decision-making process.”
Share an example of a time when you had to make a quick decision based on incomplete information.
The interviewers want to see how you make decisions under pressure when data is incomplete.
Sample Answer: “During a time-sensitive project, I had to predict sales trends with only partial data. I used historical data and identified patterns to make an informed guess. I clearly noted the limitations due to missing data and shared it with the team. This allowed us to meet the deadline while keeping decision-makers aware of the risks.”
Explain how you would communicate complex data findings to non-technical stakeholders
The interviewers want to evaluate your ability to simplify complex concepts for non-experts.
Sample Answer: “When explaining complex data, I focus on the key insights that matter to the stakeholders. I use simple language and visual aids like charts or graphs to make the findings clear. I relate the data to the business impact so they understand why it’s important. I also encourage questions to ensure everything is understood.”
Share an experience where you successfully collaborated with a cross-functional team
The interviewers want to assess your teamwork and communication skills when working with different departments.
Sample Answer: “I worked on a project with the marketing and finance teams to analyse customer behaviour. I gathered and analysed data while the marketing team provided insights into customer trends and the finance team shared budget constraints. Through open communication and regular meetings, we aligned our goals and delivered actionable insights that helped shape the marketing strategy. Collaboration ensured we met the project’s objectives successfully.”
How do you handle disagreements within a team when interpreting data results?
The interviewers want to see how you manage conflicts and differing opinions in a professional environment.
Sample Answer: “When disagreements arise over data interpretation, I focus on the data itself. I encourage everyone to share their perspective and back it up with evidence. I then review the data together, using objective methods like statistical tests to clarify the situation. This helps resolve disagreements based on facts rather than opinions.”
How do you manage multiple Data Analysis projects with tight deadlines?
The interviewers want to know your time management and organisational skills.
Sample Answer: “I prioritise projects based on deadlines and business impact. I break each project into smaller tasks and allocate time for each. I work on Project Management software to track progress and make adjustments if needed. This helps me stay organised and ensures that I meet all deadlines.”
Describe your approach to prioritising tasks when faced with conflicting project timelines
The interviewers want to assess your ability to manage competing priorities effectively.
Sample Answer: “When faced with conflicting timelines, I first assess the importance and urgency of the task. I discuss priorities with stakeholders to understand which project has a higher business impact. I focus on the most critical tasks first while communicating timelines and expectations clearly to all involved. If necessary, I delegate tasks or request deadline extensions for lower-priority projects.”
Learn the basics of data visualisation with our Data Science Analytics Course – Join today!
Situational Data Analyst Interview Questions and Answers
This section presents real-world scenarios and problem-solving questions, designed for candidates with experience handling complex data challenges.
What methods would you employ to handle missing data in a dataset?
The interviewers want to see how you manage incomplete data and your approach to cleaning datasets.
Sample Answer: “I first examine the extent and pattern of missing data to decide the best approach. If only a small portion of data is missing, I might remove those rows. For larger gaps, I use methods like mean or median imputation or predictive models to estimate the missing values. It’s important to document the approach taken for transparency in the analysis.”
How would you assess whether the missing data in a dataset is random or systematic?
The interviewers want to assess your understanding of missing data patterns and their impact on analysis.
Sample Answer: “I would start by looking for patterns in the missing data to see if it’s related to specific variables or data points. I might perform a statistical test, like Little’s MCAR test, to check if the data is missing completely at random. If the data appears to be systematic, I would investigate further to understand the underlying cause. This helps in choosing the right strategy for handling missing data.”
Imagine receiving different analysis requests from two stakeholders with conflicting goals. How would you approach this situation?
The interviewers want to know how you manage conflicting priorities and communicate with stakeholders.
Sample Answer: “I would meet with both stakeholders to fully understand their goals and timelines. Then, I would assess which request has a higher business priority or urgency. If possible, I would find a compromise by adjusting the scope or timeline of each task. Clear communication and transparency are key to managing conflicting requests effectively.”
Describe how you would clarify an ambiguous Data Analysis task provided by a manager.
The interviewers want to know how you seek clarification when faced with unclear project instructions.
Sample Answer: “I would first try to identify the unclear parts of the task and gather relevant background information. Then, I would schedule a meeting with the manager to ask specific questions about the task’s objectives, timeline, and expected outcomes. After gathering the necessary details, I would summarise my understanding of the task and confirm it with the manager before proceeding. This ensures we are aligned on the project goals.”
You discover that a dataset you are working with contains sensitive personal information. How would you handle this situation to ensure data privacy and compliance?
The interviewers want to assess your knowledge of data privacy regulations and your approach to protecting sensitive data.
Sample Answer: “First, I would notify the relevant data security team or manager about the presence of sensitive information. Then, I would ensure that I follow company policies and data privacy regulations, such as General Data Protection Regulation (GDPR) by anonymising or encrypting the sensitive data. I would also limit access to the dataset to authorised personnel only. Lastly, I would document the steps taken to comply with data privacy requirements.”
While analysing sales data, you notice a sudden and significant drop in revenue for a particular product. How would you investigate this anomaly?
The interviewers want to evaluate your problem-solving skills and your ability to investigate anomalies in data.
Sample Answer: “I would first verify the data to ensure that the drop in revenue is not due to a data entry or processing error. Next, I would explore external factors like seasonality, marketing campaigns, or competitor activity that might have influenced sales. I would also look for internal issues such as inventory shortages or pricing changes. After identifying the potential causes, I would present my findings to the relevant stakeholders.”
Imagine you have found a significant insight in your analysis that contradicts prevailing assumptions. How would you present this information to the company's leadership team?
The interviewers want to see how you present findings that challenge existing beliefs.
Sample Answer: “I would present the insight clearly and factually, using visualisations and supporting data to back up my findings. I would explain the methodology used and highlight any limitations or assumptions made during the analysis. To make it more impactful, I would relate the findings to business outcomes and suggest next steps or alternative actions. It’s important to be objective and prepared to answer any questions from leadership.”
Discuss a time when your Data Analysis led to actionable recommendations for a business.
The interviewers want to assess how your analysis translates into real business impact.
Sample Answer: “I once analysed customer purchasing patterns and found that a significant number of repeat customers purchased during discount periods. Based on this insight, I recommended increasing the frequency of targeted promotions to loyal customers. This resulted in a noticeable increase in sales during the next quarter. My analysis helped the business better engage with repeat customers and boost revenue.”
You are required to deliver an urgent analysis within a tight deadline. How do you ensure the quality of your work while working quickly?
The interviewers want to see how you manage time pressure while maintaining accuracy.
Sample Answer: “I would prioritise the most critical aspects of the analysis and focus on delivering the key insights first. To ensure quality, I would use tried-and-tested methods and tools I am familiar with, double-checking key calculations and assumptions. I would also communicate with the team or stakeholders to manage expectations and request help if needed. This allows me to meet the deadline without compromising on the accuracy of the results.”
 If you wish to make any changes to your course, please


