Get a custom course package
We may not have any package deals available including this course. If you enquire or give us a call on 01344203999 and speak to our training experts, we should be able to help you with your requirements.
Module 1: Dashboards with Power BI
Module 2: Dashboards with Excel
Module 3: Dashboards with Tableau


The Building Interactive Dashboards Training Course is designed for individuals who want to learn how to design and create dynamic and interactive dashboards for data visualisation and analysis. This course will benefit professionals, such as:
There are no formal prerequisites for attending this Building Interactive Dashboards Training Course. However, a basic knowledge of computers, data visualisation, and Excel can be beneficial.
The Building Interactive Dashboards Training Course is a dynamic exploration of creating visually compelling and user-friendly dashboards. Dashboards have become integral tools for decision-makers, allowing them to interact with and interpret complex data sets efficiently. This course delves into the art of designing interactive dashboards with real-world relevance.
Professionals in data analysis, business intelligence, project management, and strategic planning should prioritise mastering the creation of interactive dashboards. These dashboards serve as central hubs for data-driven decision-making, enabling professionals to gain insights, monitor key metrics, and communicate complex information effectively. The ability to build such dashboards is crucial for individuals aiming to enhance their analytical skills and contribute to informed decision-making processes within their organisations.
In this 1-day training by the Knowledge Academy, delegates will gain hands-on experience in constructing interactive dashboards. The course covers dashboard design principles, data visualisation techniques, and tools for interactivity. Delegates will learn to transform raw data into meaningful insights, creating dashboards that not only inform but also engage users effectively.
Course Objectives:
Upon completion of this course, delegates will gain the ability to create visually appealing and user-friendly dashboards. Whether in data analysis, business intelligence, or project management, delegates will leverage their newfound skills to design dashboards that facilitate efficient decision-making and enhance overall organisational performance.


Why choose us
Experience live, interactive learning from home with The Knowledge Academy's Online Instructor-led Building Interactive Dashboards Training. Engage directly with expert instructors, mirroring the classroom schedule for a comprehensive learning journey. Enjoy the convenience of virtual learning without compromising on the quality of interaction.
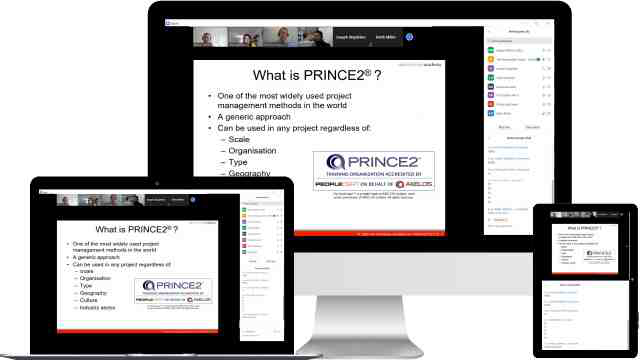
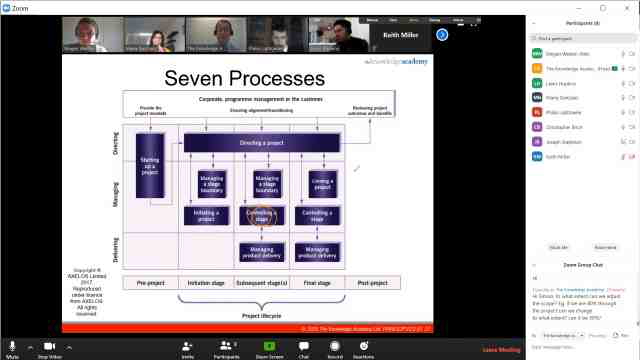
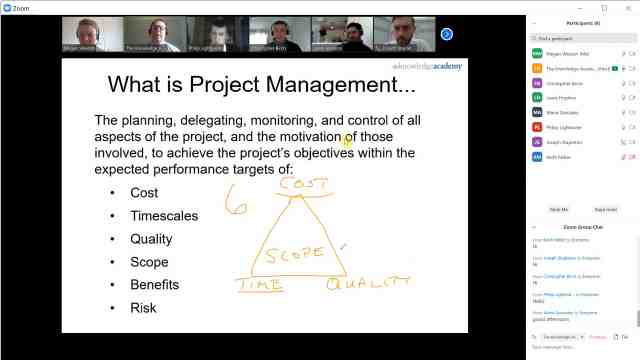

Unlock your potential with The Knowledge Academy's Building Interactive Dashboards Training, accessible anytime, anywhere on any device. Enjoy 90 days of online course access, extendable upon request, and benefit from the support of our expert trainers. Elevate your skills at your own pace with our Online Self-paced sessions.
Experience the most sought-after learning style with The Knowledge Academy's Building Interactive Dashboards Training. Available in 490+ locations across 190+ countries, our hand-picked Classroom venues offer an invaluable human touch. Immerse yourself in a comprehensive, interactive experience with our expert-led Building Interactive Dashboards Training sessions.

Boost your skills with our expert trainers, boasting 10+ years of real-world experience, ensuring an engaging and informative training experience

We only use the highest standard of learning facilities to make sure your experience is as comfortable and distraction-free as possible

Our Classroom courses with limited class sizes foster discussions and provide a personalised, interactive learning environment

Achieve certification without breaking the bank. Find a lower price elsewhere? We'll match it to guarantee you the best value
Streamline large-scale training requirements with The Knowledge Academy’s In-house/Onsite Building Interactive Dashboards Training at your business premises. Experience expert-led classroom learning from the comfort of your workplace and engage professional development.

Leverage benefits offered from a certification that fits your unique business or project needs

Cut unnecessary costs and focus your entire budget on what really matters, the training.

Our Building Interactive Dashboards Training offers a unique chance for your team to bond and engage in discussions, enriching the learning experience beyond traditional classroom settings

The course know-how will help you track and evaluate your employees' progression and performance with relative ease
good training experience


You won't find better value in the marketplace. If you do find a lower price, we will beat it.

Flexible delivery methods are available depending on your learning style.

Resources are included for a comprehensive learning experience.




"Really good course and well organised. Trainer was great with a sense of humour - his experience allowed a free flowing course, structured to help you gain as much information & relevant experience whilst helping prepare you for the exam"
Joshua Davies, Thames Water


 London
 Birmingham
 Bristol
 Milton Keynes
 Manchester
 Reading
 Glasgow
 Edinburgh
 Southampton
 Virtual
 Bath
Bath Liverpool
 Nottingham
 Bedford
 Bolton
 Newcastle
 Brighton
 Bournemouth
 Bracknell
 Cardiff
 Bromley
 Cambridge
 Burton Upon Trent
 Norwich
 Buxton
 Sheffield
 Belfast
 Dublin
 Canterbury
 Aberdeen
 Maidstone
 Carlisle
 Chatham
 Chelmsford
 Chester
 Chichester
 Chorley
 Cirencester
 Colchester
 Corby
Corby Coventry
 Crewe
Crewe Darlington
 Derby
Derby Doncaster
 Dundee
 Dunfermline
 Exeter
 Fleet
Fleet Gatwick
 Gloucester
 Guildford
 Harrogate
 Heathrow
 High Wycombe
 Hinckley
 Inverness
 Ipswich
 Kingston upon Hull
 Lincoln
 Leicester
 Luton
Luton Middlesbrough
 Northampton
 Oxford
 Peterborough
 Plymouth
 Poole
Poole Portsmouth
 Preston
 Slough
 Solihull
 Stoke-on-Trent
 Sunderland
 Swansea
 Swindon
 Teesside
 Tonbridge
 Wakefield
 Warrington
 Warwick
 Watford
 Windsor Town
 Wokingham
 Wolverhampton
 Worcester
 Wrexham
 York
York
 Back to course information
We may not have any package deals available including this course. If you enquire or give us a call on 01344203999 and speak to our training experts, we should be able to help you with your requirements.
 If you miss out, enquire to get yourself on the waiting list for the next day!

close


Press esc to close

close
Fill out your contact details below and our training experts will be in touch.


Back to Course Information