




We may not have the course you’re looking for. If you enquire or give us a call on 01344203999 and speak to our training experts, we may still be able to help with your training requirements.
What is Trend Analysis: A Complete Guide
ByThe Knowledge AcademyLast updated on: 19 August 2026
This blog explores what Trend Analysis is, its types and methods, and how it's applied across business, finance, and the stock market to identify patterns and support better decisions.

KEY TAKEAWAYS
1. Trend Analysis examines data over time to identify patterns, directions, and meaningful changes.2. Trends generally move upward, downward, or horizontally depending on how the measured values change.3. Effective Trend Analysis requires relevant data, a suitable time period, and careful interpretation of the pattern.4. Businesses can use Trend Analysis across sales, marketing, finance, operations, customer behaviour, and other areas.5. Historical trends can support forecasting and decisions, but they do not guarantee that the same pattern will continue.
Trend Analysis means looking at data over time to spot patterns and see which direction things are heading. It helps businesses understand how they've performed in the past and track how key numbers are changing.
A single number rarely tells the full story. But when you look at how that number changes over time, patterns start to emerge, patterns that would otherwise go unnoticed. That's what Trend Analysis does. It shows whether something is going up, going down, or staying roughly the same.
What is Trend Analysis?
Trend Analysis is the process of examining historical data over a period of time to identify patterns, movements, or changes in a particular variable. Instead of looking at individual data points in isolation, Trend Analysis considers how those values behave over time. This can reveal whether performance is generally improving, declining, remaining stable, or changing in another meaningful way.
For example, a business might compare monthly sales for the past two years. If sales have consistently increased, the data may indicate an upward trend. The business can then investigate what is driving that growth and use the findings to inform future decisions.

Why is Trend Analysis Important?
Individual figures can provide useful information, but they do not always show the bigger picture. Suppose a company's monthly sales are £150,000. That number alone tells us very little about overall performance. If sales were £100,000 six months ago, the figure could indicate strong growth. If they were £200,000, however, it may indicate declining performance.
Trend Analysis adds this time-based context. By comparing data across different periods, organisations can identify changes, understand performance, recognise potential opportunities or problems, and make decisions based on patterns rather than isolated observations.
Trend Analysis in 10 Seconds
PAST DATA → FIND PATTERNS → IDENTIFY DIRECTION → INTERPRET → DECIDEIn simple terms, Trend Analysis helps answer: What has been changing over time, and what does that change tell us?
Trend Analysis can also help organisations:
1) Track performance over time
2) Identify emerging changes
3) Recognise recurring patterns
4) Support forecasting and planning
5) Detect potential problems earlier
6) Compare actual and expected performance
7) Make more informed decisions
The real value isn't simply knowing that something changed. It is understanding how it has been changing and what that pattern might mean.
How Does Trend Analysis Work?
Trend Analysis works by comparing data points collected across a defined period and looking for consistent or meaningful movement. Imagine a company records the following monthly website visits:
1) January: 42,000
2) February: 45,000
3) March: 49,000
4) April: 54,000
5) May: 58,000
6) June: 63,000
Rather than analysing each month separately, the company compares the complete sequence:
42K → 45K → 49K → 54K → 58K → 63K
The overall direction is upward. However, identifying that direction is only the first part of the analysis.
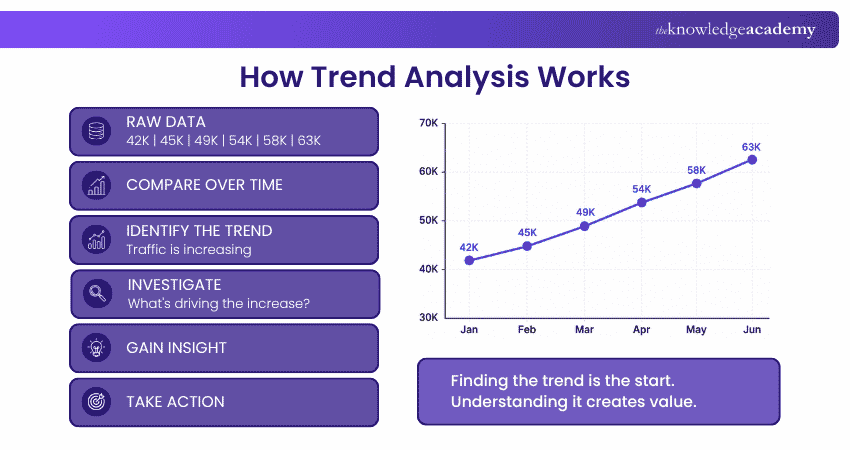
The company might then investigate:
a) What caused traffic to increase?
b) Was it a marketing campaign?
c) Improved search visibility?
d) Seasonal demand?
e) Social media activity?
f) A new product launch?
Trend Analysis therefore moves from:
Observation → Pattern → Investigation → Interpretation → Decision
Types of Trends in Trend Analysis
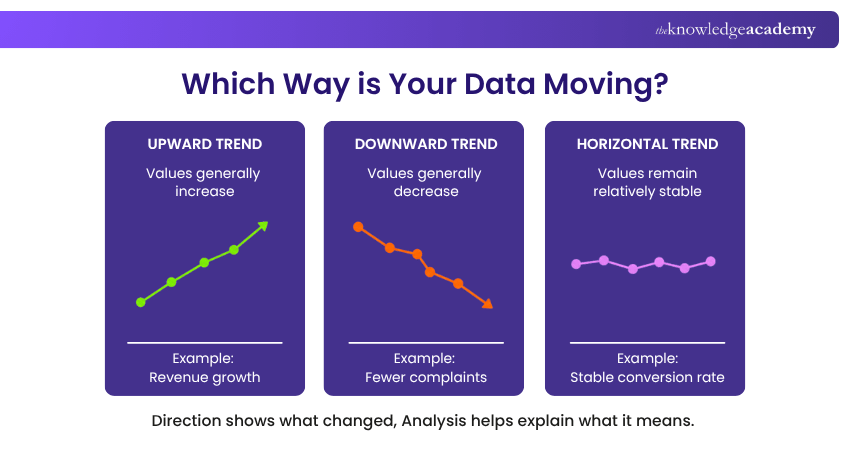
Trend direction provides a simple way to understand how data is behaving over time. The three common directions are upward, downward, and horizontal trends.
1) Upward Trend
An upward trend occurs when values generally increase over a period.
For example: Monthly Revenue
£80K → £86K → £91K → £98K → £105K
Direction: Upward
An upward trend could indicate growing sales, increasing customer demand, higher website traffic, rising costs, or another metric that is increasing.
However, an upward trend is not automatically positive. For example, increasing customer complaints or operating costs could represent an undesirable upward trend.
2) Downward Trend
A downward trend occurs when values generally decrease over time.
For example: Customer Complaints
420 → 385 → 340 → 295 → 250
Direction: Downward
A downward trend may indicate falling revenue or declining demand, but it can also represent improvement. In this example, fewer customer complaints could be a positive result.
Learn to identify promising investment opportunities with our Investment and Trading Training – Join now!
3) Horizontal Trend
A horizontal trend, sometimes called a sideways trend, occurs when values remain relatively stable over a period without a clear sustained increase or decrease.
For example: Conversion Rate
3.1% → 3.2% → 3.0% → 3.2% → 3.1%
Direction: Horizontal
This can indicate stable performance, although analysts should still examine smaller fluctuations and the wider context before reaching conclusions.
How to Perform Trend Analysis?
Effective Trend Analysis involves more than creating a chart and looking at whether the line moves up or down. Here is a simple process:
Step 1: Define Your Objective
Start by deciding what you want to understand. For example: “Has customer demand increased over the past year?” A clear objective helps determine which data and time period should be analysed.
Step 2: Choose the Right Data
Identify the metric that can answer your question. This could include:
1) Revenue
2) Sales volume
3) Customer numbers
4) Website traffic
5) Costs
6) Employee turnover
7) Production output
The quality and relevance of the data directly affect the usefulness of the analysis.
Step 3: Select a Time Period
Decide how much historical data should be examined.
Depending on the objective, this might involve daily, weekly, monthly, quarterly, or annual data. The period should be long enough to reveal meaningful patterns without introducing unnecessary or irrelevant information.
Step 4: Organise and Visualise the Data
Arrange the data chronologically and use tables, line charts, or other suitable visualisations to make changes easier to identify. Visualisation can reveal patterns that may be difficult to notice when looking at raw numbers alone.
Step 5: Identify the Trend
Look for the overall direction of the data.
Ask:
1) Is it generally increasing?
2) Is it decreasing?
3) Is it stable?
4) Are there recurring fluctuations?
5) Has the direction suddenly changed?
Step 6: Investigate What is Driving It
Finding a pattern doesn't explain why it happened. Consider internal and external factors that may have influenced the data, such as pricing changes, marketing campaigns, seasonality, customer behaviour, economic conditions, or operational changes.
Step 7: Use the Findings to Make Decisions
Finally, translate the analysis into action. If demand is consistently increasing, the organisation may need more inventory. If customer complaints are rising, it may need to investigate service quality. The purpose of Trend Analysis is not simply to produce a chart. It is to create useful information for decision-making.
Trainer's Tip: A Trend Doesn't Explain Its Cause
Finding that two things changed at the same time doesn't necessarily mean one caused the other.
For example, sales might rise after a marketing campaign, but seasonal demand, pricing changes, competitor activity, or other factors may also have contributed.
Identify the trend first. Investigate its causes next.
Common Trend Analysis Methods
Different methods can be used depending on the data, objective, and complexity of the analysis. Some common methods include:
1) Moving Averages
A moving average calculates the average value across a changing period of data. It can smooth short-term fluctuations and make the underlying direction easier to see.
For example, instead of reacting to every daily change in website traffic, a business could use a seven-day moving average to understand the broader direction.
2) Trendlines
A trendline is a line added to a chart to show the general direction of the data. It provides a simple visual representation of whether values are broadly moving upward, downward, or remaining stable.
3) Percentage Change
Percentage change measures how much a value has increased or decreased between periods. For example, if monthly revenue increases from £100,000 to £120,000:
Percentage Change = 20% increase
This makes changes easier to compare across different periods or metrics.
4) Regression Analysis
Regression Analysis examines relationships between variables and can be used to estimate trends within data.
For example, a business might analyse whether changes in advertising expenditure are associated with changes in sales over time.
5) Time Series Analysis
Time Series Analysis examines observations recorded sequentially over time.
It can help identify trends as well as other patterns such as seasonality and recurring cycles, making it useful when the timing and order of observations matter.
Learn technical analysis techniques to analyse price charts, patterns, and indicators with our Day Trading Course – Join now!
Applications of Trend Analysis
Trend Analysis can be used whenever organisations have historical data that they want to understand over time. Common applications include:
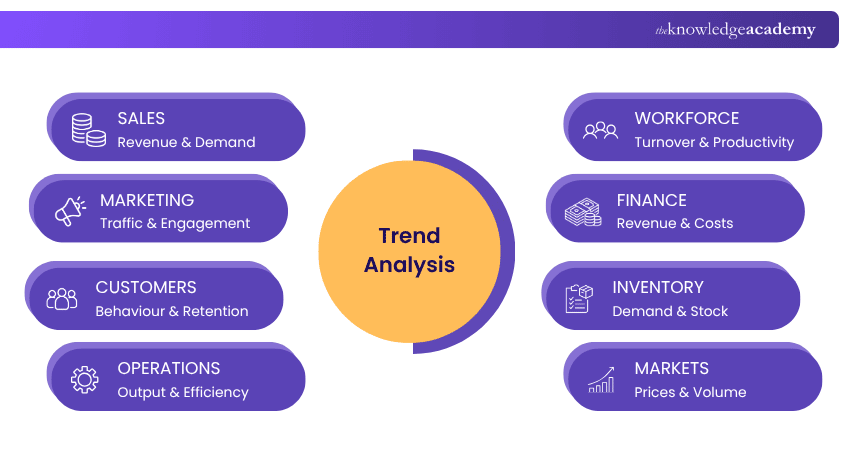
1) Sales: Businesses can analyse sales trends to identify growth, decline, seasonal demand, and changes in product performance.
2) Marketing: Teams can track website traffic, conversions, engagement, campaign performance, and other metrics to understand how results change.
3) Customer Behaviour: Changes in purchases, retention, satisfaction, and preferences can reveal shifts in customer behaviour.
4) Finance: Businesses can analyse revenue, expenses, cash flow, profit margins, and other financial measures to understand financial performance.
5) Operations: Operational data can reveal changes in productivity, production output, delivery times, quality, or efficiency.
6) Workforce: Organisations can examine trends in recruitment, employee turnover, absence, productivity, and other workforce metrics.
7) Inventory and Demand: Historical demand patterns can help businesses anticipate inventory requirements and identify seasonal changes.
8) Financial Markets: Investors and analysts can examine historical prices, volume, and other market data to identify market trends.
Advantages and Limitations of Trend Analysis
Trend Analysis can provide valuable insights, but its results need to be interpreted carefully.
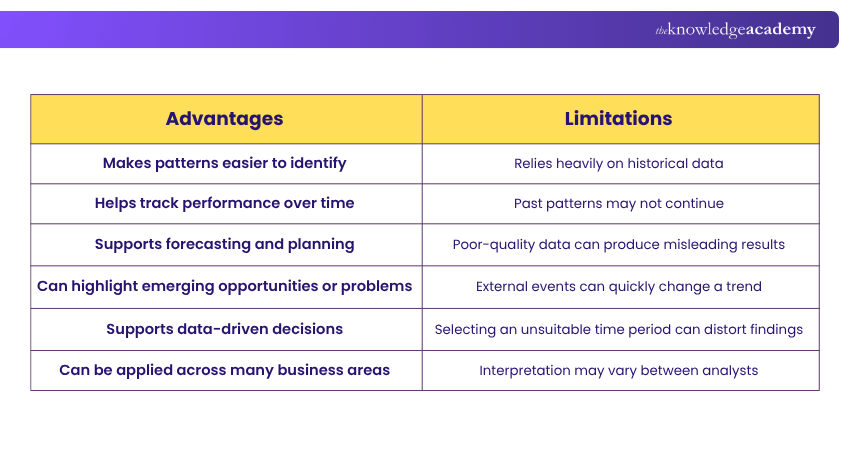
The key is to treat trends as evidence that informs a decision, rather than certainty about what will happen next.
Conclusion
Understanding What is Trend Analysis starts with a simple idea: it's about spotting direction in data, whether it's moving upward, downward, or staying flat, across areas such as sales, finance, and customer behaviour. Identifying a pattern is only the beginning; effective Trend Analysis also requires reliable data, the right time period, and investigation into what's driving it. Used carefully, it turns historical data into insights that support better-informed decisions.

The Knowledge Academy develops accessible learning content across Project Management, IT, Cybersecurity, Data Science, Business Analysis, HR, Accounting and Finance, Leadership and Health and Safety. Its resources combine subject research with clear explanations to help professionals build practical knowledge across a wide range of disciplines.
View Detail

 If you wish to make any changes to your course, please


