


We may not have the course you’re looking for. If you enquire or give us a call on 01344203999 and speak to our training experts, we may still be able to help with your training requirements.
How to Create a Project Plan in Excel: An Ultimate Guide
Eliza Taylor 19 January 2024Creating a Project Plan in Excel involves setting up a project table with tasks, start dates, and durations, and then transforming it into a Gantt chart for visual scheduling. This includes adding headers, details, and colours for clarity, updating the plan regularly, and sharing it for collaboration. While effective for simple projects, Excel's limitations in complex project management necessitate dedicated software

Microsoft Excel Course
 Top Rated Course
Top Rated Course
Exclusive 40% OFF
Training Outcomes Within Your Budget!
We ensure quality, budget-alignment, and timely delivery by our expert instructors.
Table of Contents

Success hinges upon meticulous planning, and Microsoft Excel emerges as a powerful ally for project planners. Excel's flexibility and functionality offer a dynamic canvas for outlining project objectives, charting timelines, allocating resources, and tracking progress.
Moreover, Excel's adaptable features facilitate the structured organisation of project elements, providing a platform for precision in task allocation, budgeting, and progress monitoring, ensuring project success.
In this blog, you will learn How to Create a Project Plan in Excel, thereby providing flexibility, customisation options, and a structured way to manage tasks, timelines, and resources throughout your project.
Table of Contents
1) What is a Project Plan in Excel?
2) Importance of a Project Plan in Excel
3) Process of project planning in Excel
4) Dissecting the creation of a Project Plan in Excel
5) How to make a Gantt chart in Excel
6) Exploring the top Project Plan templates in Excel
7) Conclusion
What is a Project Plan in Excel?
A Project Plan in Excel is a comprehensive document or spreadsheet that serves as the foundational roadmap for successfully executing a project. It is a dynamic tool that combines project management principles with the power of Excel's data manipulation and visualisation capabilities.
Additionally, it is an organised, data-driven strategy that helps project managers, teams, and stakeholders understand, manage, and control all aspects of a project. Moreover, Excel's versatility allows project managers to customise their project plans according to the project's unique requirements, making it an invaluable tool for effective planning, tracking, and communication.
The utilisation of Excel’s functions, formulas, and conditional formatting helps Project Managers customise their project plans according to the project's unique requirements, making it an invaluable tool for effective planning, tracking, and communication.
Here are the various components of a typical Project Plan in Excel:
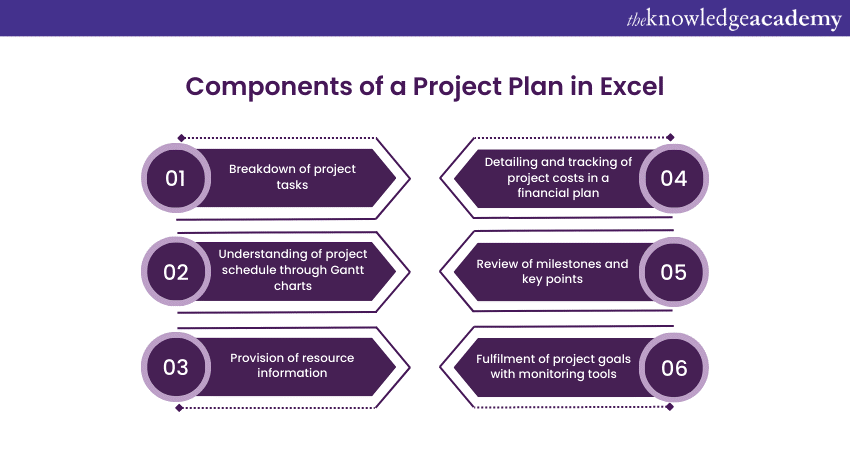
a) Task list: A detailed breakdown of all project tasks, often including task names, descriptions, start dates, end dates, and responsible team members.
b) Timelines: Project timelines are often represented using Gantt charts, providing a visual overview of when tasks begin and end, helping teams understand the project's schedule.
c) Resource management: Information on resource allocation, including human resources, equipment, and materials required for each task.
d) Budgeting: A financial plan detailing project costs, including estimates, actual expenditures, and cost tracking.
e) Milestones: Significant project achievements and key points for review.
f) Progress tracking: Tools for monitoring and updating task status, ensuring project deadlines and goals are met.

Importance of a Project Plan in Excel
The importance of a Project Plan in Excel serves as a foundational element for successful Project Management. Here are several key reasons why project plans in Excel are essential:
a) Organisation and structure: A project plan provides a structured framework that outlines the tasks, timelines, and resources required for the project. Excel's grid-like structure allows for easy organisation and clear categorisation of project elements, ensuring that nothing is overlooked.
b) Clarity and communication: Excel enables project managers to present complex project information in a clear and visually appealing manner. Gantt charts and tables can be used to convey project timelines, task dependencies, and resource allocation, making it easier for team members and stakeholders to understand the project's objectives.
c) Resource allocation: Managing resources is crucial for project success. Excel allows for efficient allocation and tracking of resources, from personnel to equipment, helping to avoid overallocation and ensuring that resources are used optimally.
d) Budget management: Projects often have financial constraints, and Excel's calculation capabilities are invaluable for budget management. Project plans in Excel can include detailed cost estimates, actual expenditures, and ongoing budget tracking, helping to keep the project within budgetary constraints.
e) Time management: Excel's ability to create Gantt charts and project timelines allows for effective time management. It helps identify critical paths, dependencies, and potential bottlenecks, enabling project managers to make adjustments as needed to keep the project on schedule.
f) Risk management: A project plan can incorporate risk assessments and mitigation strategies. By using Excel, project managers can create risk registers, track potential issues, and develop contingency plans, ensuring that unforeseen challenges are addressed promptly.
g) Continuous monitoring and control: Project plans in Excel can be easily updated as the project progresses, ensuring that the team is always working with the most current information. This real-time tracking enables project managers to address deviations from the plan promptly and make informed decisions to keep the project on track.
h) Collaboration and accountability: Excel allows for collaboration among team members and stakeholders by providing a centralised platform for sharing and updating project information. This fosters accountability and transparency within the project team.
Process of project planning in Excel
Project planning is a critical phase in the lifecycle of any project, and using Excel as your tool of choice can greatly enhance the process. Below is a list describing the various steps on how to plan a project in Excel, including the key steps and considerations:
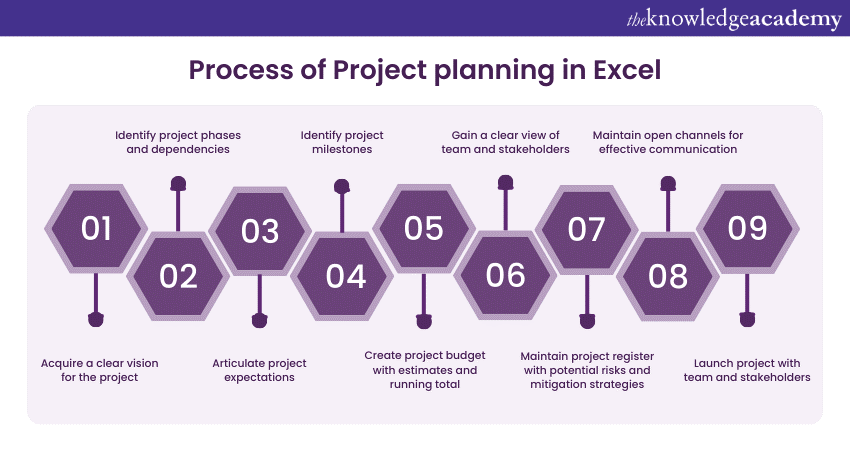
a) Understand the project's concept: Before diving into Excel, it's crucial to have a deep understanding of the project's concept. What is the project's scope, objectives, and expected outcomes? Take time to gather information and consult with stakeholders to gain a clear vision of the project.
b) Create a project workflow: Start by outlining a project workflow. In Excel, this can be done by creating a flowchart or a high-level project timeline. This visual representation will help you identify the major phases and dependencies within the project.
c) Set your outcome expectations: Define what success looks like for your project. What are the deliverables, key performance indicators, and criteria for success? Create a section in your Excel spreadsheet where you can clearly articulate these outcome expectations.
d) Identify your project's milestones: Break down the project into smaller, manageable components or milestones. These are significant points of progress in your project. In Excel, create a milestone table with columns for milestones, their descriptions, and target dates.
e) Create a project budget: Budgeting is a fundamental aspect of project planning. Excel is an ideal tool for creating detailed project budgets. Set up a budget worksheet that includes cost estimates, actual expenditures, and a running total to monitor expenses.
f) Build your team: Identify the key team members and stakeholders for your project. In Excel, you can create a table or a chart listing their names, roles, contact information, and responsibilities. This provides a clear view of who is involved and what their contributions will be.
g) Conduct risk assessment: Assess potential risks that may impact your project's success. Use Excel to create a risk register that outlines the risks, their potential impact, likelihood, and mitigation strategies. Regularly update this register as the project progresses.
h) Set up communication channels: Effective communication is vital for project success. In Excel, you can create a communication plan that outlines who needs to be informed about project updates, how often, and through which channels (e.g., email, meetings). This ensures that stakeholders are kept in the loop.
i) Launch your project: After completing the above steps, you're ready to launch your project. In Excel, you can treat your project plan as a living entity that evolves as the project unfolds. Share the plan with your team and stakeholders and ensure everyone is aligned on the project's objectives and the plan's contents.
Prepare data and make Gantt Charts in Excel by signing up for our Excel Training with Gantt Charts now!
Dissecting the creation of a Project Plan in Excel
A well-structured project plan in Microsoft Excel is an indispensable tool for project managers. It provides a clear roadmap for project execution, helps manage resources, and tracks progress efficiently. Project Managers can take the guidance of the following steps to make their Project Plan in Excel:
a) Step 1: Open Microsoft Excel and create a new workbook by launching Microsoft Excel on your computer. This will be your blank canvas for building your project plan.
b) Step 2: Set up worksheet tabs in Excel, allows you to work with multiple worksheets within a workbook. Consider creating tabs for different aspects of your project plan, such as ‘Project overview’, ‘Task list’, ‘Timeline’, ‘Resource allocation’, and ‘Budget’.
c) Step 3: A project overview can be made by starting with a "Project Overview" worksheet where you provide key details about the project. Remember to include the project title, a brief description, start and end dates, the project manager's name, and contact information. This sets the context for the entire plan.
d) Step 4: Create a ‘Task list’ worksheet to outline all project tasks. Include columns for task names, descriptions, start dates, end dates, task owners, and task status. Excel's grid structure makes it easy to input and organise this information.
e) Step 5: To create a project timeline, you can use Excel to build a Gantt chart. Create a "Timeline" worksheet and list tasks along a timeline using Excel's bar chart or stacked bar chart feature. You can format it to include task dependencies, durations, and milestones.
f) Step 6: Develop a "Resource Allocation" worksheet to document the resources required for each task. Include columns for resource names, roles, allocation dates, and the percentage of their time allocated to the project. Excel's calculations can help you manage resource utilisation effectively.
g) Step 7: Budget Excel is excellent for budget management. Create a "Budget" worksheet to list estimated and actual project costs. Include categories like labour, materials, and other expenses, and use Excel's formulas for calculations and tracking.
h) Step 8: You can create a "Risk Assessment" worksheet to identify and assess potential risks to your project. Include columns for risk descriptions, impact, probability, and mitigation strategies. Excel allows you to sort and filter data for better risk management.
i) Step 9: Build a "Communication Plan" worksheet to outline how project stakeholders will be informed and updated. Include information on who to contact, communication methods, frequency, and key messages.
j) Step 10: Once your project plan is complete, save it as an Excel file. Ensure that it's accessible to all team members and stakeholders who need it. You can also consider using cloud storage or project management software to facilitate collaboration and real-time updates.
k) Step 11: Your project plan in Excel is not static. Regularly update it as the project progresses, making adjustments as necessary. This will help keep the plan aligned with the project's actual status.
Apply data analytical approaches to solve business problems by signing up for our Business Analytics with Excel Masterclass now!
How to make a Gantt chart in Excel?
Creating a Gantt chart in Excel is a straightforward process and a valuable tool for visualising project timelines and task dependencies. Here are the steps on how to create a Gantt chart in Microsoft Excel:
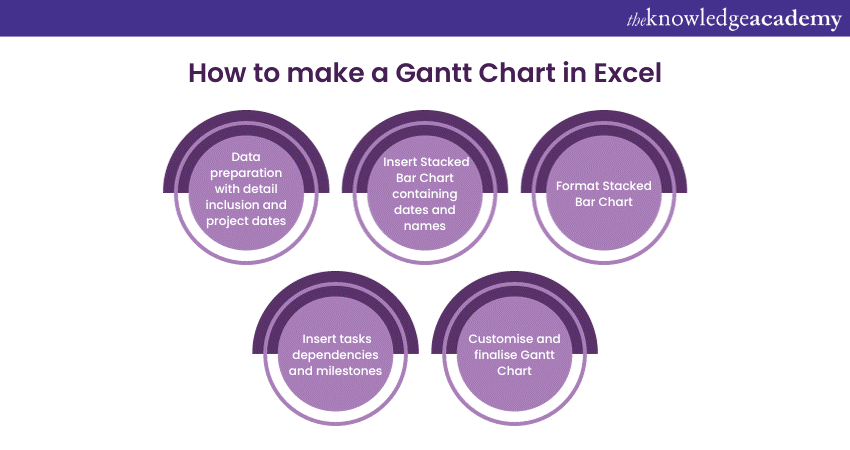
Step 1: Prepare your data
Here are the key steps to prepare your data for a Gantt chart in Excel:
a) Begin by listing all the project tasks in one column. Include details like task names, start dates, and durations.
b) Create another column for start dates and a separate column for task durations. You can also include columns for end dates if your data doesn't already have them.
Step 2: Insert a Stacked Bar Chart
Here are the key steps to insert a Stacked Bar Chart in Excel:
a) Select the data you've just prepared, including the task names, start dates, and durations.
b) Go to the "Insert" tab on the Excel ribbon.
c) Choose "Bar Chart" from the chart options. Then, select Stacked Bar."
Step 3: Format the chart
Here are the key steps to format the created chart in Excel:
a) Your chart will initially appear as a stacked column chart. To convert it into a Gantt chart, you'll need to make some adjustments:
b) Switch the task names to the vertical axis: Right-click on the task names on the left side of the chart and choose "Format Axis." In the "Axis Options" menu, change the "Text Axis" option to "On Tick Marks." This will display task names on the left.
c) Format the date axis: Right-click on the horizontal date axis, select "Format Axis," and set the "Minimum" value to your project's start date and the "Maximum" value to your project's end date.
d) Remove task duration bars: Select the series representing the task durations and format it to have no fill or border. This will leave only the task start dates visible.
Step 4: Add task dependencies and milestones
Here are the key steps to add dependencies and milestones for tasks in Excel:
a) To represent task dependencies, add additional rows to your data and adjust the start dates accordingly. In your chart, you can visually link dependent tasks by extending the bar of one task to the start of the next task.
b) To include milestones, insert additional rows in your data for milestone tasks and plot them on your Gantt chart. You can format milestones with distinctive markers or labels.
Step 5: Customise and finalise your Gantt Chart
Here are the key steps for customising and finalising your Gantt chart in Excel:
a) Customise the chart appearance as needed. You can adjust colours, fonts, and labels to enhance clarity and readability.
b) Add a title to your Gantt chart and include a legend if necessary.
c) Save your Gantt chart as a separate sheet or as part of your project plan document.
d) Regularly update your Gantt chart to reflect the actual progress of your project. Adjust task bars, dependencies, and milestone dates as the project unfolds.
Exploring the top Project Plan templates in Excel
Excel offers a versatile platform for creating project plan templates, providing Project Managers with a wide range of options to suit their specific needs. Here are some of the top Project Plan templates in Excel:
a) Basic Gantt Chart template: This template is perfect for straightforward project timelines. It includes a simple Gantt chart where you can list tasks, set start and end dates, and visualise task dependencies.
b) Project timeline template: A project timeline template in Excel provides a clear visual representation of the project's schedule, making it easy to track progress and milestones. It often includes separate columns for task names, start and end dates, and additional notes.
c) Task tracker template: Task tracker templates in Excel help you monitor task progress, assign responsibilities, and track deadlines. They include features for highlighting task completion and identifying overdue tasks.
d) Agile Project Plan template: For Agile Project Management, Excel templates can be customised to accommodate sprint planning, user stories, and burndown charts, helping agile teams track progress and adapt to changing requirements.
e) Project budget template: Excel is excellent for budget management. These templates allow you to create detailed project budgets, track expenses, and compare them with budget estimates.
f) Resource allocation template: Resource allocation templates help you manage your project's human and material resources. They include sections for listing resources, their roles, and allocation details, helping you ensure efficient resource utilisation.
Create and manipulate data in spreadsheets by signing up for our Microsoft Excel Masterclass now!
Conclusion
We hope you have become familiarised with How to Create a Project Plan in Excel. The versatility of Excel empowers Project Managers to streamline tasks, track progress, and communicate with stakeholders seamlessly.
Frequently Asked Questions
Upcoming Office Applications Resources Batches & Dates
Date
 Microsoft Excel Course
Microsoft Excel Course
Mon 3rd Jun 2024
Microsoft Excel Course
Mon 17th Jun 2024
Microsoft Excel Course
Mon 1st Jul 2024
Microsoft Excel Course
Mon 15th Jul 2024
Microsoft Excel Course
Mon 5th Aug 2024
Microsoft Excel Course
Mon 19th Aug 2024
Microsoft Excel Course
Mon 2nd Sep 2024
Microsoft Excel Course
Mon 16th Sep 2024
Microsoft Excel Course
Mon 7th Oct 2024
Microsoft Excel Course
Mon 21st Oct 2024
Microsoft Excel Course
Mon 4th Nov 2024
Microsoft Excel Course
Mon 18th Nov 2024
Microsoft Excel Course
Mon 2nd Dec 2024
Microsoft Excel Course
Mon 9th Dec 2024
Microsoft Excel Course
Mon 16th Dec 2024
Microsoft Excel Course
Mon 13th Jan 2025
Microsoft Excel Course
Mon 3rd Feb 2025
Microsoft Excel Course
Mon 10th Mar 2025
Microsoft Excel Course
Mon 7th Apr 2025
Microsoft Excel Course
Mon 19th May 2025
Microsoft Excel Course
Mon 9th Jun 2025
Microsoft Excel Course
Mon 14th Jul 2025
Microsoft Excel Course
Mon 4th Aug 2025
Microsoft Excel Course
Mon 8th Sep 2025
Microsoft Excel Course
Mon 6th Oct 2025
Microsoft Excel Course
Mon 10th Nov 2025
Microsoft Excel Course
Mon 1st Dec 2025
 If you wish to make any changes to your course, please


