


We may not have the course you’re looking for. If you enquire or give us a call on 01344203999 and speak to our training experts, we may still be able to help with your training requirements.
Best Network Troubleshooting Tools to Consider
ByThe Knowledge AcademyLast updated on: 06 November 2026
Network troubleshooting tools help IT professionals identify connectivity, DNS, routing and performance issues. Explore 12 useful tools, their key features, diagnostic commands and practical applications to understand how different solutions can support network troubleshooting.
The Gist
1. Connectivity and Routing: Ping, Traceroute and Test-NetConnection help investigate basic reachability, network paths and TCP connectivity.2. DNS and Configuration: Nslookup, Ipconfig/ip and Netstat/ss help examine DNS resolution, IP settings and network connections.3. Packet Analysis: Wireshark and tcpdump support detailed packet inspection to investigate communication problems.4. Network Performance: Ookla Speedtest, PingPlotter and iPerf3 help assess internet speed, latency, packet loss and network throughput.5. Network Discovery: Nmap helps identify hosts, accessible ports and services during network troubleshooting.
Imagine an important client meeting being interrupted because employees cannot access a shared application. Some users report slow connections, while others cannot connect at all. Identifying the cause requires more than restarting devices. Network troubleshooting tools help IT professionals investigate where communication problems occur.
From checking basic connectivity to examining individual data packets, network troubleshooting tools provide different ways to diagnose technical issues. In this blog, we explore the essential tools, their key features and practical applications, along with guidance on selecting the most suitable option for common network problems.
Best Network Troubleshooting Tools
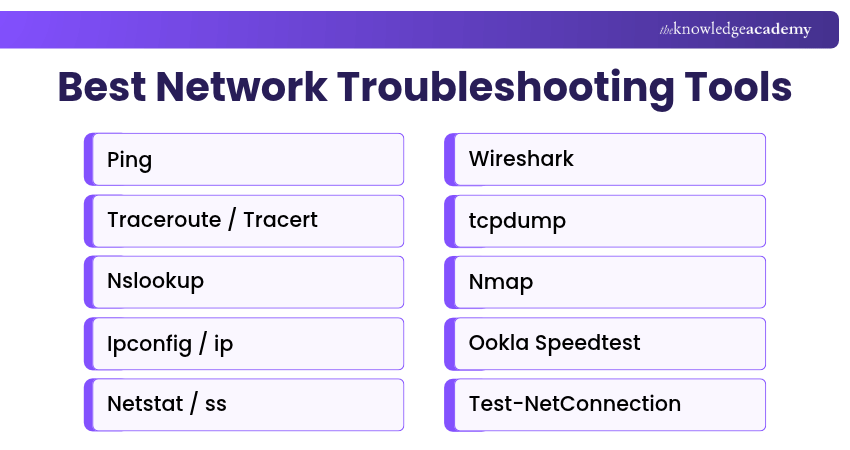
Different network troubleshooting tools serve different purposes. Some identify basic connectivity problems, while others examine network packets, discover devices or test application services. Here are 12 network troubleshooting tools worth knowing:
1) Ping
Ping is a widely used command-line utility for checking basic IP connectivity between a computer and another network device. It sends Internet Control Message Protocol (ICMP) Echo Request messages to a destination and measures the responses received.
This can help determine whether the target responds and provide an indication of round-trip latency. However, a missing response does not always mean the destination is unreachable, as firewalls or network settings may block ICMP traffic.
Key Features:
a) Connectivity Testing: Checks whether a destination responds to ICMP Echo Requests.
b) Latency Measurement: Reports round-trip times for received replies.
c) Packet Loss Observation: Identifies unanswered probes during a test.
d) Simple Command-line Access: Provides a quick starting point for basic network diagnosis.
Example Command:
ping example.com
Best For: Checking basic IP reachability and observing latency or packet loss.

2) Traceroute / Tracert
Traceroute and Tracert are diagnostic utilities that help investigate the network path towards a destination. Traceroute is commonly used on Linux and macOS, while Tracert is the Windows equivalent. These tools send probes with progressively increasing hop limits to identify intermediate routers that return diagnostic responses.
Key Features:
Path Identification: Displays responding intermediate network hops.
Response-time Measurement: Reports timing information from responding devices.
Routing Investigation: Helps examine potential connectivity or path-related problems.
Cross-platform Availability: Provides comparable functionality across major operating systems.
Example Command:
tracert example.com
This is a Windows example. On Linux, use the appropriate traceroute command if installed.
Best For: Investigating network paths and possible routing-related connectivity problems.
3) Nslookup
Nslookup is a command-line utility used to query Domain Name System (DNS) servers and retrieve information about domain names and IP addresses. It helps investigate situations where websites or applications cannot be reached because hostnames are not resolving as expected. Network Administrators can use Nslookup to examine DNS records, compare responses from different DNS servers and investigate domain resolution problems.
Key Features:
a) DNS Queries: Retrieves DNS information for specified domain names.
b) Record Lookup: Supports queries for records such as A, AAAA, MX and NS.
c) Server Selection: Allows queries against a specified DNS server.
d) Resolution Diagnosis: Helps identify missing, incorrect or unexpected DNS responses.
Example Command:
nslookup example.com
Best For: Investigating DNS resolution problems and checking domain records.
4) Ipconfig / ip
Ipconfig and ip are command-line utilities used to inspect network configuration information. Ipconfig is primarily associated with Windows, while the ip utility is commonly used on modern Linux systems.
These tools help administrators examine IP addresses, network interfaces and other configuration information when diagnosing connectivity problems. For example, an incorrect local IP address or default gateway may prevent a computer from communicating with other devices.
Key Features:
a) IP Address Inspection: Displays configured addresses on network interfaces.
b) Interface Information: Helps examine local network configuration.
c) Gateway and Route Investigation: Provides information relevant to network connectivity.
d) Configuration Troubleshooting: Helps identify missing or incorrect settings.
Example Commands:
Windows: ipconfig /allLinux: ip address showLinux routing information: ip route show
Best For: Diagnosing local IP configuration and network interface problems.
5) Netstat / ss
Netstat and ss are command-line utilities used to examine network connections, listening ports and socket information. Netstat remains available in several operating environments, while ss is commonly used on modern Linux systems for examining socket statistics.
These tools help administrators identify which network services are listening for connections and investigate active communication sessions. They are particularly useful when diagnosing applications that are not accepting connections or are using unexpected network ports.
Key Features:
a) Connection Inspection: Displays information about active network connections.
b) Listening Port Identification: Helps identify services accepting incoming connections.
c) Protocol Information: Provides details about TCP and UDP sockets.
d) Connection State Analysis: Supports examination of established and other connection states.
Example Commands:
Windows: netstat -anoLinux: ss -tuln
Best For: Investigating active connections, listening ports and local service availability.
6) Wireshark
Wireshark is an open-source network protocol analyser that allows users to inspect network packets through a graphical interface. It is widely used by network professionals to investigate protocol behaviour, communication errors and unusual traffic patterns.
Wireshark can display individual packets, apply filters and provide detailed information about supported network protocols. This makes it useful when basic commands cannot explain why a network service or connection is behaving unexpectedly.
Key Features:
a) Packet Capture: Captures network packets from supported interfaces.
b) Protocol Analysis: Examines detailed information about supported network protocols.
c) Display Filters: Helps isolate traffic relevant to a particular issue.
d) Traffic Investigation: Supports analysis of retransmissions, errors and protocol exchanges.
Best For: Detailed packet analysis and diagnosing complex communication problems.
Trainer's Insight
Packet analysis is most useful when the capture includes the actual failure. Start capturing on the appropriate network interface, reproduce the connectivity issue and stop once sufficient evidence is collected. Packet captures may contain sensitive information, so restrict access and follow your organisation's security procedures.
7) tcpdump
tcpdump is a command-line packet analyser commonly used on Linux, Unix and other compatible systems. It allows administrators to capture and inspect network traffic without relying on a graphical interface.
This makes tcpdump particularly useful for investigating connectivity issues on remote servers, network appliances and systems where graphical applications are unavailable. Administrators can also save captured traffic for further analysis using compatible packet-analysis tools.
Key Features:
a) Command-line Packet Capture: Captures network traffic from supported interfaces.
b) Traffic Filtering: Allows users to focus on particular hosts, ports or protocols.
c) Capture File Support: Saves traffic for subsequent investigation.
d) Remote System Troubleshooting: Supports diagnostics in command-line environments.
Example Command:
sudo tcpdump -i eth0
Replace eth0 with the correct interface. Run packet captures only on systems and networks you are authorised to inspect.
Best For: Command-line packet analysis and troubleshooting server-side network traffic.
8) Nmap
Nmap is an open-source network discovery and security auditing utility used to examine hosts and accessible network services. It helps administrators identify responsive devices, investigate exposed ports and gather information about services on authorised networks.
Nmap can support troubleshooting when a device is unexpectedly unavailable or a required service cannot be reached. Its scanning capabilities are also widely used for network inventory and security assessments.
Key Features:
a) Host Discovery: Identifies devices responding to supported discovery methods.
b) Port Scanning: Checks the state of selected network ports.
c) Service Detection: Helps identify services associated with accessible ports.
d) Network Inventory: Supports the discovery and examination of network devices.
e) Best For: Network discovery, port investigation and authorised network assessments.
Power the technology that powers business with the IT Support and Solution Training now!
9) Ookla Speedtest
Ookla Speedtest is an internet performance testing service that measures connection characteristics such as download speed, upload speed and latency. It provides an accessible way to investigate whether an internet connection is performing as expected.
Speedtest can help identify potential performance problems affecting activities such as video meetings, file transfers and cloud application access. However, test results can vary depending on the selected server, network congestion and local testing conditions.
Key Features:
a) Download Speed Testing: Measures the rate at which data is received.
b) Upload Speed Testing: Measures the rate at which data is transmitted.
c) Latency Measurement: Provides information about connection response times.
d) Performance Comparison: Allows users to repeat tests and compare results.
Best For: Investigating internet throughput and basic connection performance.
10) Test-NetConnection
Test-NetConnection is a Windows PowerShell cmdlet that provides diagnostic information about network connections. It supports basic connectivity testing, TCP port checks, route tracing and additional network diagnostics.
This makes it useful when a device responds to Ping but a particular application or service remains inaccessible. For example, an administrator can use Test-NetConnection to determine whether a TCP connection to a required service port succeeds.
Key Features:
a) Connectivity Testing: Checks basic reachability using supported diagnostic methods.
b) TCP Port Testing: Tests connectivity to a specified remote TCP port.
c) Route Diagnostics: Provides information about network paths and route selection.
d) Detailed Results: Displays relevant connection and interface information.
Example Command:
Test-NetConnection example.com -Port 443
Best For: Diagnosing Windows network connectivity and remote TCP port availability.
11) PingPlotter
PingPlotter is a network troubleshooting tool that helps identify latency, packet loss and connection instability over time. It combines repeated network path measurements with visual graphs, allowing administrators to investigate intermittent performance problems that may not appear during a single Ping or Traceroute test.
The tool displays network paths, response times and packet-loss patterns to help users investigate where performance issues may occur. For example, an IT professional troubleshooting unstable video calls can use PingPlotter to monitor connection quality and compare performance across different network hops.
Key Features:
a) Continuous Network Monitoring: Tracks latency and packet loss over time.
b) Network Path Visualisation: Displays responding network hops and their performance measurements.
c) Historical Performance Analysis: Uses graphs to examine intermittent connection problems.
d) Jitter Analysis: Helps assess variations in latency, with dedicated jitter graphing available in supported editions.
Best For: Investigating intermittent connectivity, packet loss, latency and unstable network performance.
12) iPerf3
iPerf3 is an open-source network performance testing tool used to measure throughput between two network endpoints. It uses a client-server model and supports TCP, UDP and SCTP testing, helping administrators evaluate network capacity and investigate performance limitations.
Unlike internet speed testing services, iPerf3 allows administrators to test communication between controlled endpoints. For example, an IT professional can use it to measure throughput between two servers on a local network and investigate whether network performance is affecting application communication.
Key Features:
a) Throughput Measurement: Measures the rate of data transfer between network endpoints.
b) Protocol Testing: Supports TCP, UDP and SCTP throughput tests on supported platforms.
c) Performance Analysis: Reports throughput and relevant metrics, including jitter and packet loss during UDP testing.
d) Configurable Testing: Allows administrators to adjust test duration, bandwidth targets and parallel connections.
Best For: Measuring network throughput and investigating performance between controlled network endpoints.
Keep This in Mind
No single network troubleshooting tool can identify every connectivity or performance issue. The right choice depends on the problem, network environment and operating system. Combining suitable diagnostic tools and interpreting their results carefully can help IT professionals identify underlying causes and resolve network issues more effectively.
Understand various types of computer maintenance and troubleshooting with our Computer Hardware Troubleshooting Course – Join now!

The Knowledge Academy develops accessible learning content across Project Management, IT, Cybersecurity, Data Science, Business Analysis, HR, Accounting and Finance, Leadership and Health and Safety. Its resources combine subject research with clear explanations to help professionals build practical knowledge across a wide range of disciplines.
View Detail

 If you wish to make any changes to your course, please


