


We may not have the course you’re looking for. If you enquire or give us a call on 01344203999 and speak to our training experts, we may still be able to help with your training requirements.
Top 10 HR Analytics Tools: Features and How to Choose
ByNaveena VenkatesanLast updated on: 02 November 2026
HR analytics tools help organisations collect, examine and interpret workforce data to support informed HR decisions. This blog explores 10 HR analytics tools and their features, along with practical guidance on selecting a suitable tool for your organisation.
The Main Insights
1. HR analytics tools help organisations analyse workforce data and identify meaningful trends.2. The top tools include general-purpose tools such as Python, Excel, Power BI and Tableau, alongside dedicated people analytics platforms such as Visier and Crunchr.3. Key features include data analysis, visualisation, reporting and workforce planning capabilities.4. Different tools serve different purposes, from basic HR reporting to advanced statistical analysis.5. Choosing the right tool involves assessing integration, usability, analytical features, data security and costs.
It's Friday at 4:55 PM. Then comes that one request!
You're wrapping up your work when an urgent message arrives: “Can you send the latest employee turnover figures before you leave?” Suddenly, you're searching through spreadsheets, checking dates and wondering which report contains the most recent numbers.
Situations like this highlight the importance of maintaining accurate and accessible workforce information. HR analytics tools can help teams prepare reports, examine patterns and make workforce data easier to work with.
So, which tools could make a difference to your everyday HR tasks? This blog explores 10 HR analytics tools, their features and how to select a suitable solution.
Top 10 HR Analytics Tools
HR analytics tools differ in their purposes, technical requirements and analytical capabilities. Some support straightforward calculations and visualisation, while others provide specialised workforce reporting and more advanced analysis.
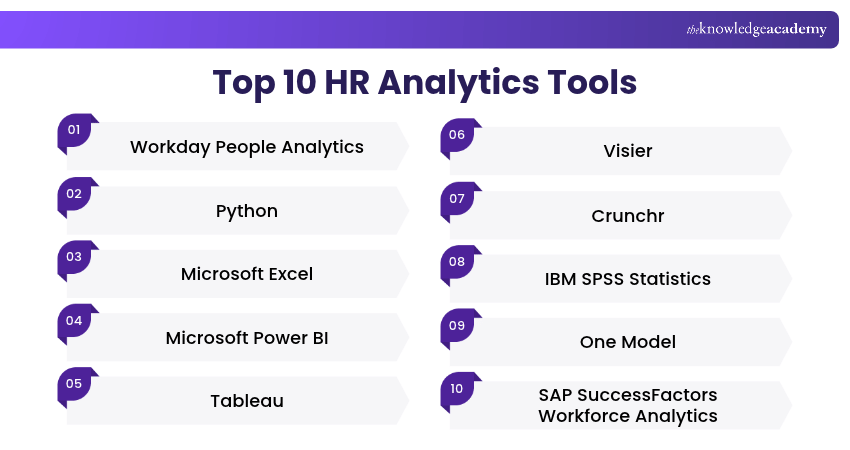
Here are 10 tools, programming technologies and analytics platforms that organisations can use to examine workforce information.
1) Workday People Analytics
Workday People Analytics is an augmented analytics application designed to help organisations examine workforce data and identify meaningful trends. It uses analytical methods to surface insights into areas such as employee movement, workforce composition and organisational performance.
The application works within the Workday environment and presents relevant workforce findings to support HR and management discussions. It is an additional product rather than a feature automatically included in every Workday HCM subscription.
Key Features:
1) Automated identification of workforce trends and patterns
2) Insights into employee and organisational metrics
3) Analytical findings presented in accessible formats
4) Integration with relevant Workday workforce data
Example: An HR manager uses Workday People Analytics to examine changes in employee turnover across departments and identify patterns that require further investigation.

2) Python
Python is a general-purpose programming language widely used for data processing, automation, statistical analysis and machine learning. It can support HR analytics when organisations need to combine, transform or analyse information from different systems.
Libraries such as pandas and NumPy assist with data preparation and calculations, while scikit-learn supports machine learning workflows. Python can also automate recurring reporting tasks when appropriate data access and security controls are in place.
Key Features:
1) Data cleaning and transformation
2) Automation of repetitive analytical tasks
3) Statistical analysis and visualisation
4) Machine learning and predictive modelling
Example: An HR analytics team uses Python to combine authorised recruitment datasets and calculate monthly application volumes, interview rates and time-to-hire.
3) Microsoft Excel
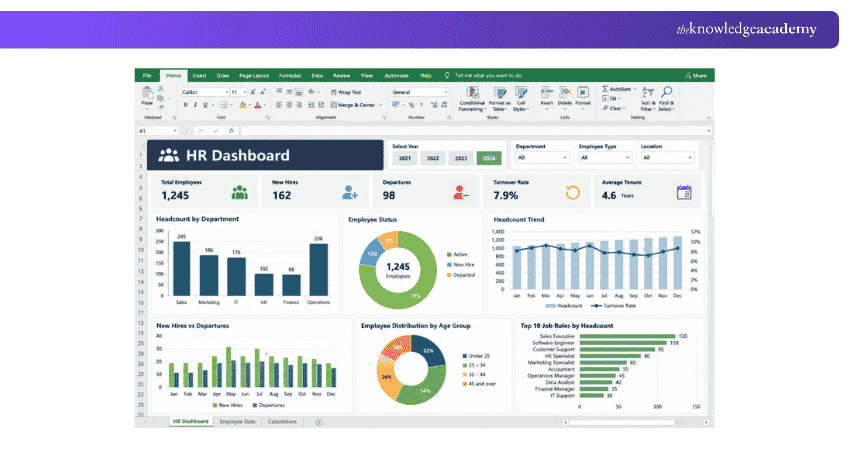
Microsoft Excel is a spreadsheet application used for organising, calculating and analysing information. It is a practical option for HR teams that need to prepare recurring reports or investigate manageable datasets without building a dedicated analytics system.
Features such as formulas, PivotTables, charts and Power Query can help HR professionals summarise employee records, prepare workforce reports and identify inconsistencies in data.
Key Features:
1) Formulas and spreadsheet calculations
2) Pivot tables and charts
3) Data filtering and conditional formatting
4) Data import and transformation through Power Query
Example: An HR Administrator uses Excel to create a monthly report showing employee headcount, new starters and departures by department.
Pro Tip: Check Your Data Before Creating Reports
Before analysing workforce data, review duplicate records, missing dates and inconsistent department names. These issues can produce misleading headcount, absence or turnover figures.
4) Microsoft Power BI
Microsoft Power BI is a Business Intelligence (BI) and data visualisation platform that helps organisations connect data sources, develop reports and share analytical findings.
HR teams can use Power BI to create interactive workforce dashboards and examine changes in recruitment, employee headcount and staff departures. Its data modelling and calculation features support more complex reporting than basic spreadsheet summaries.
Key Features:
1) Interactive reports and dashboards
2) Connections to multiple data sources
3) Data modelling and calculations
4)Sharing and controlled access to reports
Example: An HR Analyst creates a Power BI report comparing employee headcount, new hires and voluntary departures across different departments and reporting periods.
Power BI is particularly useful when organisations want to provide repeatable, interactive reports to authorised HR and management users.
Learn to transform raw data into interactive dashboards and insightful reports with our Microsoft Power BI Training – Join now!
5) Tableau
Tableau is a data visualisation and business intelligence platform used to explore information and present findings through interactive dashboards.
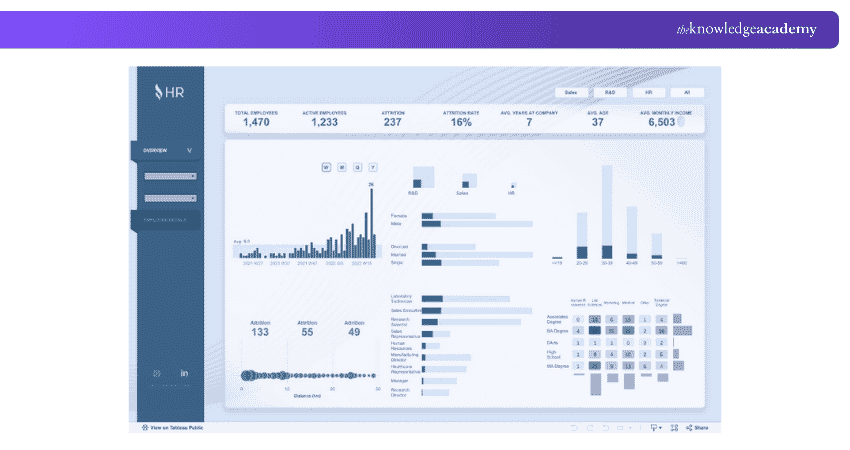
HR professionals can use Tableau to examine workforce composition, recruitment patterns, compensation information and employee turnover. Its visual exploration capabilities help users investigate differences between groups, departments and reporting periods.
Key Features:
1) Interactive data visualisation
2) Connections to different data sources
3) Customisable dashboards
4) Filtering and exploration of workforce metrics
Example: An HR Manager uses Tableau to compare employee turnover rates across locations and examine whether changes are concentrated within particular departments.
Tableau is relevant when visual exploration and communication of findings are major priorities. Creating reliable reports still requires suitable data preparation, metric definitions and access controls.
6) Visier
Visier is a dedicated people analytics platform designed to help organisations understand workforce trends and support HR planning.
Unlike general-purpose analytics software, Visier focuses specifically on workforce data and provides prebuilt HR metrics, dashboards and analytical insights. Organisations can use it to examine employee movement, retention, workforce composition and other people-related measures.
Key Features:
1) Workforce-focused dashboards and reporting
2) Analysis of employee movement and retention
3) Data integration and standardised workforce metrics
4) Workforce forecasting and scenario planning through Visier's workforce planning solutions
Example: An HR team uses Visier to investigate changes in voluntary turnover across departments and compare them with relevant workforce characteristics.
7) Crunchr
Crunchr is a people analytics platform designed to help HR professionals organise, analyse and visualise workforce information. It provides customisable dashboards that help teams explore workforce trends and employee-related metrics.
Organisations can use Crunchr to analyse employee turnover, workforce composition and other HR measures through interactive reporting and data exploration. Its people analytics focus makes it particularly relevant to teams seeking accessible, self-service workforce insights.
Key Features:
1) Prebuilt and customisable HR dashboards
2) Predefined HR metrics and analytical views
3) Interactive data exploration and drill-down analysis
4) Drag-and-drop workforce visualisations
Example: An HR team uses Crunchr to compare employee headcount and turnover patterns across departments and prepare workforce reports for management discussions.
8) IBM SPSS Statistics
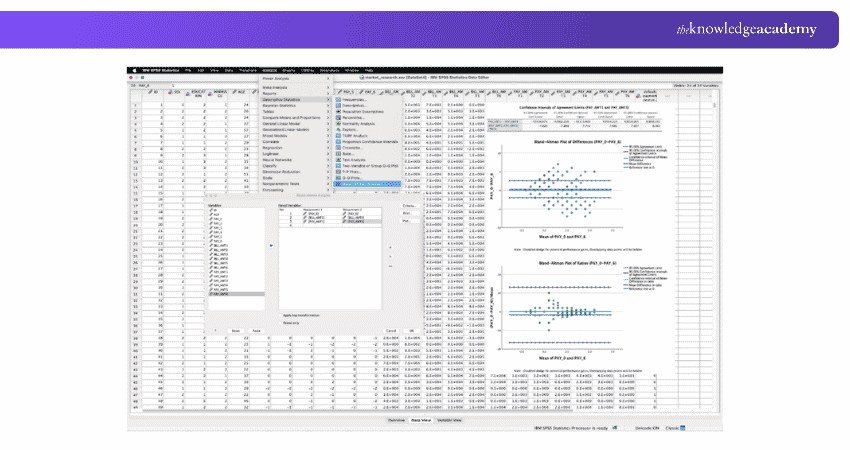
IBM SPSS Statistics is statistical analysis software used to examine datasets, evaluate relationships between variables and apply statistical methods.
It can support HR research involving employee surveys, workplace assessments and other quantitative information. The software provides analytical procedures such as descriptive statistics, regression and hypothesis testing, with additional capabilities depending on the licensed modules.
Key Features:
1) Descriptive statistics and statistical testing
2) Regression and other analytical methods
3) Data preparation and transformation
4) Tables, charts and statistical reporting
Example: An HR researcher uses SPSS to investigate relationships between survey responses about workplace conditions and reported job satisfaction.
SPSS can be useful for formal statistical analysis, but users still need to understand the chosen methods and interpret the results correctly.
9) One Model
One Model is a dedicated people analytics platform designed to bring together workforce information from multiple HR and business systems.
It supports data integration, workforce data modelling, reporting and interactive visualisations. Its platform also offers AI-assisted analysis through One AI, alongside forecasting and planning capabilities, subject to the relevant product access and configuration.
Key Features:
1) Integration of workforce data sources
2) Standardised workforce metrics and governed data modelling
3) Interactive reports and storyboards
4) Advanced analytics capabilities in applicable offerings
Example: A large organisation uses One Model to combine authorised HR, recruitment and payroll information and develop consistent workforce reports across business units.
One Model may be appropriate when organisations need a governed workforce data foundation and want to reduce inconsistencies between reports produced by different systems.
10) SAP SuccessFactors Workforce Analytics
SAP SuccessFactors Workforce Analytics is a workforce analytics solution within the wider SAP SuccessFactors environment. It helps organisations examine workforce trends, composition, risks and opportunities through standardised HR metrics and analytical reporting.
It is particularly relevant to organisations using SAP SuccessFactors systems and seeking consistent workforce measures. Its supported data sources and integration requirements vary between SAP HANA-based and SQL-based configurations.
Key Features:
1) Standardised workforce metrics
2) Workforce trend and composition analysis
3) Reporting on workforce changes
4) Integration with relevant HR data sources
Example: An organisation uses SAP SuccessFactors Workforce Analytics to analyse employee movements, compare workforce trends across reporting periods and support workforce planning discussions.
SAP SuccessFactors Workforce Analytics can provide useful HR reporting capabilities, but organisations should verify their existing SAP environment, licensing and available integrations before selecting a solution.
Which HR Analytics Tool Should You Consider?
|
Your Main Requirement
|
Tools Worth Exploring
|
|
Prepare routine HR reports
|
Microsoft Excel
|
|
Build interactive workforce dashboards
|
Microsoft Power BI, Tableau
|
|
Conduct statistical workforce research
|
IBM SPSS Statistics or Python
|
|
Automate processing or develop custom models
|
Python
|
|
Use a dedicated people analytics platform
|
Visier or One Model
|
|
Analyse workforce data within an SAP SuccessFactors environment
|
SAP SuccessFactors Workforce Analytics
|
These are starting points rather than definitive recommendations. Your choice should also reflect data integration requirements, user expertise, available budget and information security obligations.
How to Choose the Right HR Analytics Tool?
Selecting an HR analytics tool involves understanding what your organisation needs to analyse and assessing whether a potential solution can provide reliable information.
The following six factors can help you make an informed choice:
1) Identify Your HR Analytics Requirements: Begin with the workforce questions your organisation needs to answer. For example, you might want to understand employee turnover, monitor recruitment performance or compare staffing levels across departments. Define relevant metrics before evaluating the software.
2) Assess Data Integration Capabilities: Review whether the tool can connect to your existing HRIS, payroll, applicant tracking and other authorised systems. Consider how information will be updated, combined and checked for consistency to avoid conflicting reports.
3) Consider Ease of Use and Scalability: Assess the technical knowledge required to operate the tool and whether it suits the intended users. Also consider whether the solution can support changes in workforce size, data volume and reporting requirements.
4) Review Reporting and Analytical Features: Determine whether the software provides the reporting capabilities your organisation actually needs. These might include interactive dashboards, statistical analysis, forecasting or scheduled reports. Advanced features are useful only when they support a genuine requirement.
5) Evaluate Data Security and Compliance: Examine access controls, authentication, data retention, vendor responsibilities and applicable data protection obligations. Employee information can be sensitive, so organisations should assess whether the planned processing is lawful, appropriate and proportionate. Automated or predictive workforce analysis may require additional safeguards.
6) Compare Costs, Support and Implementation: Consider more than the subscription or licence price. Review setup, integrations, ongoing administration, employee training and vendor support. A solution that appears inexpensive initially may require additional resources to operate effectively.
Trainer’s Insight: Start With the Question, Not the Tool
Before comparing platforms, write down one specific workforce question your team needs to answer. Identify the data required and the decision it will support. Then use that requirement to assess suitable tools instead of choosing software solely because it offers advanced features.
Learn from seasoned HR professionals with real-world experience with our HR Leadership Courses – Register now!

Naveena Venkatesan is a Content Editor with 2+ years of experience in content writing, editing and linguistic quality assurance. Her research, fact-checking and editorial experience enable her to develop accurate, accessible resources across Business Skills, Human Resources, and Accounting and Finance.
View Detail

 If you wish to make any changes to your course, please


