


We may not have the course you’re looking for. If you enquire or give us a call on 01344203999 and speak to our training experts, we may still be able to help with your training requirements.
Best Data Storytelling Tools and Features
ByThe Knowledge AcademyLast updated on: 04 November 2026
Discover 15 of the best data storytelling tools for turning complex information into clear, engaging narratives. Explore platforms for interactive dashboards, charts, infographics, geographical storytelling and AI-assisted reports, and find out how to choose the right option for your needs.
The Rundown
1. Microsoft Power BI and Tableau present insights through interactive reports and dashboards.2. Flourish and Observable help create engaging, explorable data visualisations.3. Infogram and Canva transform information into accessible visual content.4. ArcGIS StoryMaps and StoryMapJS combine maps with location-based narratives.5. D3.js and Jupyter support technical data storytelling through custom visualisations and reproducible analysis.
Imagine presenting hundreds of sales figures to an audience that struggles to identify the most important findings. A well-designed visual story can turn those figures into clear trends, comparisons and meaningful conclusions. This is where data storytelling tools become valuable.
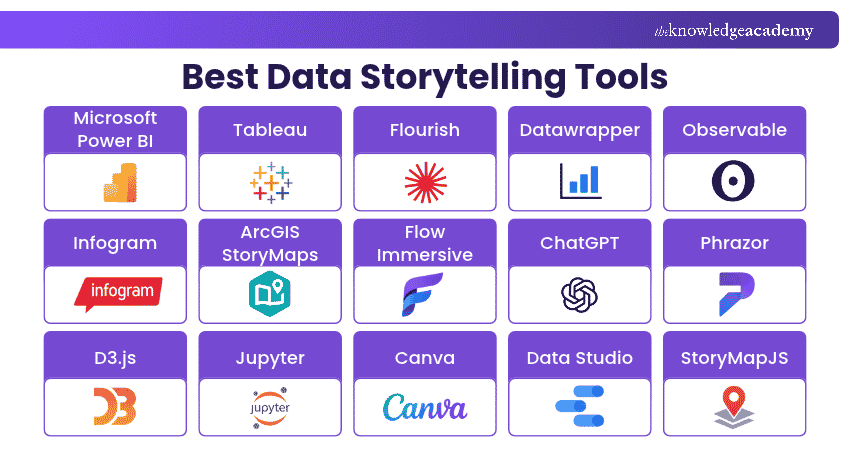
From interactive dashboards and animated charts to infographics and geographical narratives, data storytelling tools help businesses, analysts and content creators communicate information effectively. In this blog, we explore 15 data storytelling tools, their key features and how to select the right one for your storytelling needs.
Best Data Storytelling Tools
Selecting the right data storytelling tool depends on your objectives, technical experience and preferred presentation format. Some platforms specialise in business reporting, while others focus on interactive storytelling, visual design or custom development.
1) Microsoft Power BI
Microsoft Power BI is a business intelligence platform that helps organisations analyse information and communicate insights through interactive reports and dashboards. It integrates with various data sources, making it suitable for monitoring business performance and identifying meaningful trends.
Its bookmarking and interactive reporting capabilities can help users guide audiences through important findings while allowing further exploration of the underlying information.
Key Features:
a) Interactive Dashboards: Create visual reports that present important business metrics.
b) Data Connectivity: Connect information from databases, spreadsheets and cloud services.
c) Report Bookmarks: Capture report views to support guided presentations.
d) Data Modelling: Establish relationships between datasets for comprehensive analysis.

2) Tableau
Tableau is a visual analytics platform that helps users explore data, identify patterns and present insights through interactive visualisations. It supports business reporting, exploratory analysis and structured data narratives.
One of its notable storytelling capabilities is Tableau Stories, which allows users to arrange visualisations into sequential story points. This helps audiences follow a particular finding, understand supporting evidence and explore relevant details.
Key Features:
a) Story Points: Organise charts and dashboards into a guided narrative.
b) Interactive Visualisations: Explore trends through filters and visual interactions.
c) Data Connections: Analyse information from supported databases and services.
d) Dashboard Creation: Combine multiple visualisations into a unified report.
Best For: Data Analysts and professionals presenting complex business insights.
3) Flourish
Flourish is a data visualisation and storytelling platform that allows users to create interactive charts, maps and animated visual narratives. Its template-based approach helps users present information without requiring extensive programming knowledge.
The platform supports stories that connect several visualisations into a sequence. It also offers scrollytelling capabilities for eligible plans, enabling visual content to change as readers progress through a webpage.
Key Features:
a) Interactive Templates: Create animated charts and data-driven visualisations.
b) Story Creation: Arrange charts and explanatory content into narrative sequences.
c) Scrollytelling: Build scroll-based storytelling experiences with Publisher and Enterprise plans.
d) Publishing Options: Share or embed visual content on websites.
Best For: Journalists, content creators and professionals developing interactive stories.
Trainer Insight
Design interactions with a purpose. For example, a time slider can demonstrate how regional sales have changed over several years. Rather than adding animation purely for visual appeal, use it to explain an important pattern or strengthen the central narrative.
4) Datawrapper
Datawrapper is an online data visualisation tool for creating charts, maps and tables. Its accessible interface helps users transform datasets into clear visual content for articles, reports and presentations. The platform is particularly useful for professionals who need informative, publication-ready visualisations without extensive technical knowledge.
Key Features:
a) Chart Creation: Build charts for comparing values, distributions and trends.
b) Mapping Tools: Create geographical visualisations for location-based information.
c) Responsive Design: Produce visuals that adapt to different screen sizes.
d) Publishing Options: Embed and share charts, maps and tables.
Best For: Journalists, researchers and professionals publishing data-driven content.
5) Observable
Observable is a platform for exploring data and developing custom visualisations. It combines programming capabilities with tools for creating interactive data experiences, making it useful for technically skilled users. Its ecosystem allows developers to build visual explanations, connect analytical processes with narrative context and publish customised data applications.
Key Features:
a) Custom Visualisations: Develop tailored charts using programming tools.
b) Interactive Components: Build experiences that respond to user input.
c) Data Exploration: Analyse information through flexible development workflows.
d) Visual Publishing: Create and share interactive data content.
Best For: Developers and Data Scientists creating customised visual narratives.
6) Infogram
Infogram is a visual content creation platform that supports charts, infographics, maps, dashboards and reports. It combines data visualisation with design features to help users communicate findings clearly. Its template-based editor makes it useful for presenting survey results, performance figures and other datasets in accessible formats.
Key Features:
a) Interactive Charts: Create visualisations that audiences can explore.
b) Infographic Templates: Present data within structured visual layouts.
c) Dashboard Design: Combine multiple charts into a single presentation.
d) Collaboration: Work with team members on shared visual communication projects.
Best For: Marketing professionals and teams producing visual reports and infographics.
7) ArcGIS StoryMaps
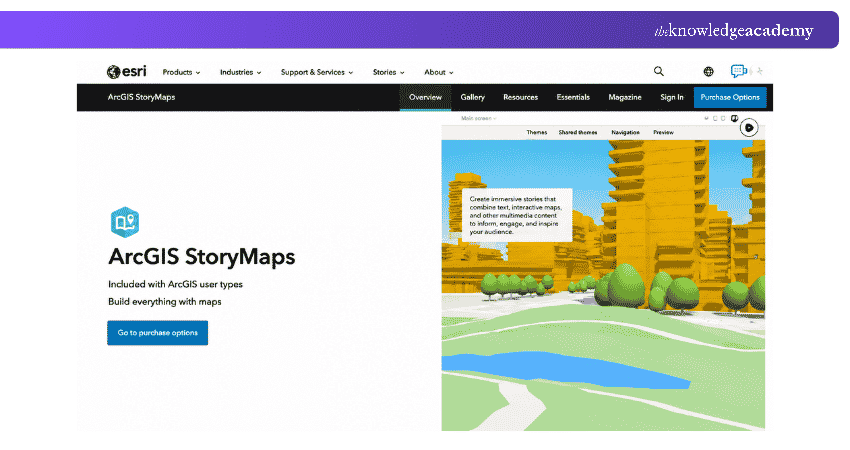
ArcGIS StoryMaps is a web-based storytelling platform developed by Esri. It allows users to combine maps, multimedia and written explanations to create narratives centred on geographical information.
The platform is particularly valuable when location plays an important role in the story. Users can explain environmental changes, regional developments and spatial relationships through interactive maps and supporting content.
Key Features:
a) Interactive Maps: Incorporate geographical information into visual narratives.
b) Multimedia Storytelling: Combine maps with images, videos and written explanations.
c) Story Builder: Organise information into structured digital stories.
d) Presentation Tools: Create map-based presentations to communicate geographical insights.
Best For: GIS professionals, researchers and organisations communicating geographical insights.
8) Flow Immersive
Flow Immersive is a spatial data storytelling platform that helps users communicate information through three-dimensional visual experiences. It offers an alternative to conventional charts by presenting relationships and patterns within interactive 3D environments.
The platform supports guided, multi-step data stories and AI-assisted creation, allowing audiences to explore information through spatial presentations.
Key Features:
a) 3D Visualisations: Present complex information in interactive spatial formats.
b) Guided Narratives: Structure visual experiences into sequential explanations.
c) AI-assisted Creation: Develop data stories using AI assistance and supplied information.
d) Browser-based Sharing: Present interactive stories through web links.
Best For: Presenters and organisations exploring immersive data communication.
9) ChatGPT
ChatGPT is an AI assistant that can support different stages of data storytelling, including exploring datasets, identifying potential patterns and drafting explanations. Users can provide supported data files and ask questions to help interpret information.
It can also assist with developing narrative structures and creating charts. However, AI-generated findings should be independently checked before being included in business reports or published stories.
Key Features:
a) Data Analysis Assistance: Explore uploaded datasets and answer analytical questions.
b) Narrative Development: Draft explanations based on supplied findings.
c) Chart Generation: Help visualise supported datasets.
d) Conversational Exploration: Refine analytical questions through follow-up prompts.
Best For: Professionals developing initial insights, explanations and data narratives.
Pro Tip: Verify AI-generated Findings
When using AI to create data stories, verify numerical claims against the original dataset. Check calculations, confirm that supporting evidence matches the explanation and distinguish correlation from causation. This helps reduce the risk of presenting misleading conclusions.
Learn about chatbot customisation and deployment with our ChatGPT Course – Join now!
10) Phrazor
Phrazor, developed by vPhrase, is a natural language generation platform designed to transform structured data into written insights and automated reports. It helps organisations communicate numerical information through explanations that provide context.
Unlike tools focused mainly on visual design, Phrazor emphasises narrative reporting, making it useful for communicating recurring business information.
Key Features:
a) Natural Language Generation: Convert structured information into written narratives.
b) Automated Reporting: Generate explanations for recurring analytical reports.
c) Data Interpretation: Communicate significant patterns and changes.
Best For: Businesses producing recurring analytical reports and written insights.
11) D3.js
D3.js is an open-source JavaScript library for producing customised data visualisations using web technologies. It allows developers to connect data with page elements and control how visual content is displayed and updated. Its flexibility makes it suitable for complex storytelling projects that require unique chart layouts, interactive behaviour or visual transitions.
Key Features:
a) Custom Visualisations: Create charts and graphical representations tailored to specific datasets.
b) DOM Manipulation: Connect data with web page elements.
c) Interactive Behaviour: Develop animations, transitions and user-driven interactions.
d) Flexible Development: Use web technologies to create distinctive visual experiences.
Best For: Experienced developers building highly customised data stories.
12) Jupyter
Jupyter provides open-source tools for interactive computing that combine executable code, explanatory text and visual outputs. It is widely used in data science, research and analytical workflows. Jupyter notebooks are particularly useful for technical data storytelling because they allow users to document analytical steps alongside charts, calculations and interpretations.
Key Features:
a) Interactive Notebooks: Combine code, written explanations and visual outputs.
b) Data Analysis: Work with supported programming languages and analytical libraries.
c) Visualisation Integration: Generate charts using compatible libraries.
d) Reproducible Workflows: Document analytical processes for review and collaboration.
Best For: Data Scientists, researchers and analysts presenting technical findings.
13) Canva
Canva is an online visual communication platform that allows users to design presentations, infographics, reports and other visual content. Its charting and design features help professionals transform information into accessible data stories.
The platform is particularly useful for presenting established findings to non-technical audiences through attractive layouts and consistent visual designs.
Key Features:
a) Chart Creation: Build charts to communicate comparisons, trends and proportions.
b) Visual Templates: Use ready-made layouts for infographics and presentations.
c) Branding Tools: Apply consistent colours, fonts and design elements.
d) Collaborative Editing: Work with team members on shared visual projects.
Best For: Educators, marketers and professionals creating presentation-ready visual stories.
14) Data Studio
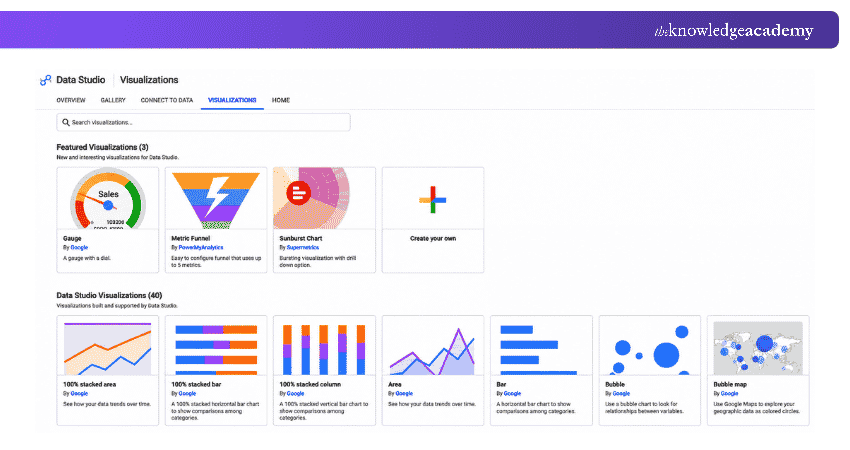
Data Studio, formerly known as Looker Studio, is a reporting and data visualisation platform that helps users create interactive dashboards and share analytical findings. It supports connections with services such as Google Analytics, Google Sheets and Google Ads, making it particularly useful for communicating digital marketing and website performance.
Key Features:
a) Interactive Reports: Build dashboards with charts, tables and filtering controls.
b) Data Connections: Combine information from supported Google services and other sources.
c) Customisable Layouts: Add text, visuals and branding to reports.
d) Report Sharing: Collaborate and distribute dashboards to relevant audiences.
Best For: Digital Marketers and Data Analysts creating performance reports.
Understand how to connect, manage, and visualise data effectively with our Google Data Studio Training – Join now!
15) StoryMapJS
StoryMapJS is an open-source storytelling tool developed by Knight Lab. It allows users to create location-based narratives by combining maps, text and multimedia in a sequence of slides. Unlike advanced GIS platforms, StoryMapJS focuses on a straightforward storytelling format, making it suitable for historical accounts, travel narratives and other stories where locations provide essential context.
Key Features:
a) Map-based Slides: Present information through geographical story points.
b) Multimedia Integration: Combine locations with images, text and supported media.
c) Sequential Storytelling: Guide audiences through a location-based narrative.
d) Embedding: Publish stories within websites and other online content.
Best For: Journalists, educators and content creators developing geographical narratives.
Data Storytelling Quality Checklist
□ Before publishing your data story, check the following:□ The main insight is clear and supported by the data.□ The chosen charts accurately represent the figures.□ Titles and labels explain the information without ambiguity.□ The narrative provides sufficient context for the findings.□ Data sources and relevant dates are clearly identified.□ The final story has been proofread for errors and misleading claims.
Develop clear data visualisations with the Data Analysis and Visualisation with Python Training – Sign up now!

The Knowledge Academy develops accessible learning content across Project Management, IT, Cybersecurity, Data Science, Business Analysis, HR, Accounting and Finance, Leadership and Health and Safety. Its resources combine subject research with clear explanations to help professionals build practical knowledge across a wide range of disciplines.
View Detail

 If you wish to make any changes to your course, please


