


We may not have the course you’re looking for. If you enquire or give us a call on 01344203999 and speak to our training experts, we may still be able to help with your training requirements.
Home
 Resources
Programming & DevOps
Top 15 Application Performance Monitoring Tools: Features and Uses
Resources
Programming & DevOps
Top 15 Application Performance Monitoring Tools: Features and Uses
Top 15 Application Performance Monitoring Tools: Features and Uses
ByThe Knowledge AcademyLast updated on: 04 November 2026
Discover 15 application performance monitoring tools that help organisations track application health, analyse response times and identify performance bottlenecks. Compare the features and practical applications of platforms such as New Relic, Dynatrace, Datadog and IBM Instana to identify a suitable APM solution.
Before You Pick an APM Tool
1. Slow Applications? Look for transaction monitoring and code-level diagnostics to identify performance bottlenecks.2. Complex Microservices? Distributed tracing helps track requests across interconnected services.3. Frequent Application Errors? Error tracking and alerts help teams investigate recurring failures.4. Limited Performance Visibility? Dashboards and service maps reveal application behaviour and dependencies.5. Unsure Which Tool Fits? Compare technology support, deployment options, integrations and monitoring costs.
"The application is running. So why are users complaining that it's slow?"
"Server performance looks normal."
"But checkout requests are taking too long!"
"Is it the database, application code or another service?"
Everything looks fine on the surface, but something isn't working. Sounds familiar? Just because an application is running doesn't mean it's performing well. When multiple services, databases and APIs are involved, identifying what's causing a slowdown can feel like searching for a needle in a haystack.
That's where Application Performance Monitoring (APM) tools come into play! They help teams look beyond surface-level metrics, trace performance issues and uncover potential bottlenecks.
But with so many options available, how do you find the right one? In this blog, we'll explore 15 APM tools, their key features and practical applications to help you make an informed choice.
15 Best Application Performance Monitoring Tools
Application Performance Monitoring (APM) tools help organisations monitor application behaviour, detect performance issues and maintain reliable digital services. These tools and platforms vary in their capabilities and intended environments. Some offer advanced monitoring for enterprise applications, while others specialise in cloud-native systems, distributed tracing or code-level diagnostics.
Here are 15 application performance monitoring tools worth exploring:
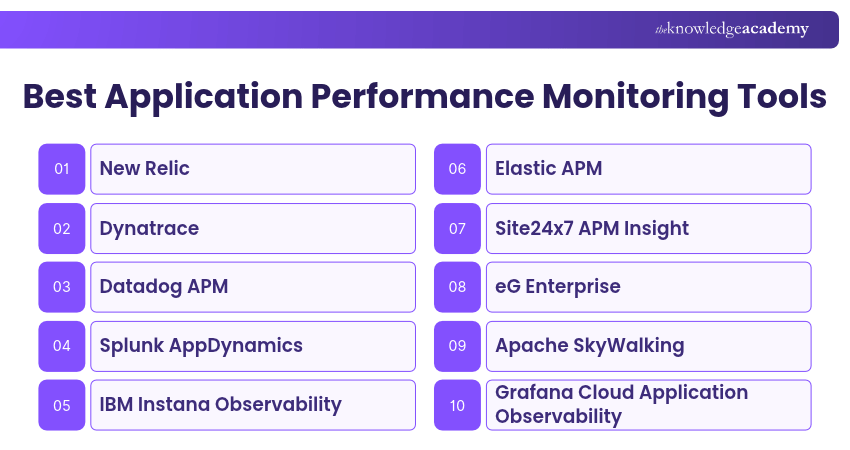
1) New Relic
New Relic is an application performance monitoring and observability platform that helps teams track application health, analyse transactions and investigate performance issues across supported environments.
New Relic also connects application metrics with distributed traces, errors and supporting infrastructure data to provide additional troubleshooting context.
Key Features:
a) Transaction Monitoring: Track application response times, throughput and error rates across important transactions.
b) Distributed Tracing: Follow requests across connected services to identify delays and failures.
c) Service Maps: Visualise service dependencies and understand how connected components affect application performance.
d) Error Analysis: Investigate application exceptions and recurring errors to support troubleshooting.
Best For: Organisations seeking application diagnostics and integrated full-stack observability.

2) Dynatrace
Dynatrace is an observability platform that provides application performance monitoring across cloud-native, hybrid and enterprise environments. It helps teams understand application behaviour, monitor service dependencies and investigate technical problems.
Its automated discovery and AI-assisted analysis capabilities support monitoring in complex environments where multiple applications and infrastructure components interact.
Key Features:
a) Automated Discovery: Identify supported application components and map their dependencies.
b) Distributed Tracing: Analyse requests across interconnected services to investigate latency and transaction failures.
c) AI-assisted Root Cause Analysis: Correlate performance signals and identify potential root causes of application issues using contextual analysis.
d) Application Diagnostics: Examine service performance, database interactions and application errors.
Best For: Large organisations managing complex applications across hybrid and cloud environments.
3) Datadog APM
Datadog APM is an application performance monitoring solution that helps organisations track service health and analyse distributed application behaviour. It provides visibility into transactions across microservices, databases and external dependencies.
The platform integrates application traces with related metrics and logs, allowing teams to investigate performance problems within a broader observability environment.
Key Features:
a) Distributed Tracing: Follow application requests across services to locate delays and errors.
b) Service Monitoring: Examine request rates, latency, error rates and service dependencies.
c) Trace Explorer: Search, filter and analyse individual traces to investigate performance bottlenecks and application errors.
d) Telemetry Correlation: Connect application traces with relevant logs and metrics for troubleshooting.
Best For: DevOps teams managing cloud-native applications and distributed services.
4) Splunk AppDynamics
Splunk AppDynamics is an enterprise application performance monitoring solution that focuses on business transactions, application health and technical diagnostics.
It helps organisations understand how applications process important activities, such as user logins, payments and checkout requests. Teams can examine transactions across application tiers and investigate performance issues affecting business operations.
Key Features:
a) Business Transaction Monitoring: Monitor application workflows and measure their performance.
b) Code-level Diagnostics: Investigate slow transactions, application methods and database operations.
c) Application Flow Maps: Visualise dependencies between application services and infrastructure components.
d) Performance Baselines: Compare transaction performance against dynamically calculated baselines to identify abnormal behaviour.
Best For: Enterprises requiring detailed monitoring of business-critical application transactions.
5) IBM Instana Observability
IBM Instana Observability is an application performance monitoring platform designed to provide automated visibility into application environments. It helps teams monitor application services, analyse requests and understand how different components interact.
The platform is particularly relevant to microservices and containerised environments where application components frequently change.
Key Features:
a) Automatic Discovery: Automatically detect supported application components and map service dependencies as environments change.
b) Distributed Tracing: Examine requests across application services and dependencies.
c) Application Analytics: Investigate response times, errors and application performance patterns.
d) Root Cause Analysis: Correlate application monitoring data to help identify potential causes of performance problems.
Best For: Organisations managing dynamic applications, microservices and containerised workloads.
6) Elastic APM
Elastic APM is an application performance monitoring solution within the Elastic Observability ecosystem. It collects application performance data to help teams investigate response times, transaction behaviour and errors.
It is particularly suitable for organisations using or planning to adopt the Elastic Stack, as application telemetry can be analysed alongside other observability data in Kibana.
Key Features:
a) Transaction Monitoring: Measure application response times and analyse incoming requests.
b) Distributed Tracing: Follow transactions across instrumented services to locate performance bottlenecks.
c) Error Tracking: Capture application exceptions and group related errors for investigation.
d) Performance Metrics: Collect application and runtime metrics to provide additional diagnostic context.
Best For: Development and operations teams using the Elastic Stack for monitoring and analysis.
7) Site24x7 APM Insight
Site24x7 APM Insight is an application performance monitoring solution that helps teams track application transactions, response times and performance bottlenecks.
It provides application-level diagnostics alongside broader monitoring capabilities available within the Site24x7 platform. This allows teams to investigate application performance alongside related infrastructure and website monitoring data.
Key Features:
a) Transaction Monitoring: Analyse application requests and identify slow-running transactions.
b) Code-level Diagnostics: Investigate application methods and database queries affecting performance.
c) Distributed Tracing: Follow transactions between appropriately instrumented application services to identify delays.
d) Performance Reports: Review response times, throughput, Apdex scores and historical performance trends.
Best For: IT teams seeking application diagnostics alongside infrastructure and website monitoring.
8) eG Enterprise
eG Enterprise, developed by eG Innovations, combines application performance monitoring with infrastructure monitoring and user experience visibility.
It helps organisations investigate performance problems across application servers, databases, virtualisation platforms and supporting infrastructure. This makes it particularly relevant to organisations managing complex enterprise applications.
Key Features:
a) Application Transaction Monitoring: Track business transactions across application tiers to identify slow operations.
b) Code-level Diagnostics: Examine application methods, database queries and service calls affecting performance in supported application technologies.
c) Dependency Mapping: Visualise relationships between applications and supporting infrastructure.
d) Root Cause Diagnosis: Correlate application and infrastructure performance data to help identify underlying issues.
Best For: Organisations managing enterprise applications across on-premises, virtualised and hybrid environments.
9) Apache SkyWalking
Apache SkyWalking is an open-source APM and observability platform designed for distributed systems, microservices and cloud-native applications. It helps teams monitor application performance, analyse service dependencies and investigate technical issues.
The platform combines distributed tracing, metrics and logs to provide visibility into application behaviour and identify potential performance bottlenecks.
Key Features:
a) Distributed Tracing: Track requests across interconnected services to identify latency and transaction failures.
b) Service Topology Mapping: Visualise service relationships and dependencies to understand how application components interact.
c) Application Performance Metrics: Monitor service response times, throughput and error rates to assess application health.
d) Performance Profiling: Analyse application execution behaviour through supported profiling capabilities to identify performance bottlenecks.
Best For: Development and DevOps teams managing microservices, containerised applications and cloud-native environments.
Trainer’s Insight: Look Beyond Application Uptime
An application can remain available while delivering a poor user experience. Development and operations teams should monitor response times, error rates and important transactions rather than relying only on service availability.
10) Grafana Cloud Application Observability
Grafana Cloud Application Observability is an application performance monitoring solution built around application telemetry and service-level performance analysis.
It supports OpenTelemetry-based instrumentation and helps teams investigate application requests, service dependencies and performance issues. Its knowledge graph-powered experience, available to new Grafana Cloud organisations, connects metrics, logs, traces and profiles to support troubleshooting.
Key Features:
a) Service Monitoring: Monitor request rates, error rates and latency across instrumented services.
b) Distributed Tracing: Examine request paths to identify slow operations and errors.
c) Service Discovery: Automatically discover services and their relationships from collected telemetry data in the knowledge graph-powered experience.
d) Telemetry Correlation: Investigate application metrics, traces, logs and profiles through integrated workflows.
Best For: Engineering teams using OpenTelemetry and Grafana Cloud for application observability.
Pro Tip: Check What Your Traces Actually Capture
Before selecting an APM platform, test whether its instrumentation captures the transactions, database calls and external service dependencies your team needs to investigate. Basic telemetry collection does not always provide sufficient diagnostic detail.
Learn the best practices for building and managing dashboards with our Grafana Training – Join now!
11) SigNoz
SigNoz is an OpenTelemetry-native observability platform that provides application performance monitoring through metrics, logs and distributed traces.
It helps teams examine application latency, request rates and errors while understanding how services interact. SigNoz offers cloud-hosted and self-hosted deployment options.
Key Features:
a) Application Metrics: Monitor latency percentiles, request rates, error percentages and Apdex scores.
b) Distributed Tracing: Investigate individual requests across connected services.
c) Service Dependency Mapping: Visualise relationships between services and their performance.
d) Database and External Call Monitoring: Analyse database operations and external service interactions using traces containing the required attributes and instrumentation data.
Best For: Engineering teams seeking OpenTelemetry-based APM with cloud-hosted or self-hosted deployment options.
12) ManageEngine Applications Manager
ManageEngine Applications Manager is an application and infrastructure monitoring platform with dedicated APM Insight capabilities for supported applications.
It allows IT teams to monitor application performance, track business transactions and investigate response time issues. It also provides visibility into supporting servers and infrastructure components.
Key Features:
a) APM Insight: Monitor application response times, throughput and Apdex scores.
b) Transaction Diagnostics: Examine application transactions to identify performance problems.
c) Application Health Monitoring: Monitor application availability and performance conditions.
d) Alerts and Reporting: Configure performance thresholds and analyse monitoring data through dashboards and reports.
Best For: IT operations teams seeking application and infrastructure monitoring within a combined platform.
13) Azure Monitor Application Insights
Azure Monitor Application Insights is an application performance monitoring feature of Microsoft Azure Monitor. It helps developers and IT teams monitor application health, investigate failures and analyse transaction performance.
It supports OpenTelemetry-based instrumentation for supported scenarios and integrates with Azure monitoring services.
Key Features:
a) Application Performance Monitoring: Track response times, request performance and application failures.
b) Application Map: Visualise application components and service dependencies.
c) Transaction Diagnostics: Investigate application requests and trace performance problems.
d) Live Metrics and Alerts: Monitor application activity in real time where Live Metrics are supported and configure alerts for selected performance conditions.
Best For: Organisations building or operating applications within Azure and supported connected environments.
14) JENNIFER APM
JENNIFER APM, developed by JenniferSoft, is an application performance management platform focused on real-time transaction monitoring and application diagnostics.
It provides visual monitoring of application transactions, helping teams identify slow requests, abnormal behaviour and potential performance issues.
Key Features:
a) Real-time Transaction Monitoring: Observe application transactions as they are processed.
b) X-View Performance Visualisation: Use response-time scatter graphs to identify response-time patterns and abnormal transactions.
c) Event Alerts: Receive notifications for configured performance conditions, transaction errors and exceptions.
d) Transaction Profiling: Examine individual transaction details and execution profiles to investigate performance delays.
Best For: Organisations needing real-time transaction visibility for supported web application environments.
15) Splunk APM
Splunk APM is an application performance monitoring solution within Splunk Observability Cloud. It helps teams investigate distributed applications using traces, service metrics and dependency information.
Unlike Splunk AppDynamics, which places greater emphasis on business transaction monitoring in enterprise applications, Splunk APM focuses on trace-based monitoring and performance analysis across distributed services.
Key Features:
a) Distributed Tracing: Analyse requests across instrumented services to investigate latency and errors.
b) Service Maps: Visualise relationships between application services and their dependencies.
c) Trace Analyser: Search and explore distributed traces to investigate application behaviour.
d) Service Performance Monitoring: Examine request rates, latency, error rates and relevant service-level indicators.
Best For: DevOps and site reliability engineering teams managing distributed applications.
Trainer’s Insight: Different APM Products Serve Different Needs
Splunk AppDynamics and Splunk APM are separate products. AppDynamics focuses strongly on enterprise application transactions, while Splunk APM provides distributed tracing and service-level observability through Splunk Observability Cloud. Compare their architectures and capabilities before selecting either solution.
Gain an understanding of infrastructure planning with indexer and search head clustering with our Splunk Training – Register now!
How do Application Performance Monitoring Tools Work?
Application performance monitoring tools collect telemetry from applications and analyse it to provide insights into performance and service health. Depending on the platform, data may be gathered through monitoring agents, Software Development Kits (SDKs), OpenTelemetry instrumentation or supported integrations.
Here are eight common steps involved in application performance monitoring:
1) Collect Application Data: Monitoring agents and instrumentation gather metrics, traces, errors and other supported telemetry from applications.
2) Centralise Monitoring Information: The platform receives, processes and makes collected telemetry available for monitoring and analysis, with storage handled according to the platform's architecture.
3) Measure Application Performance: APM dashboards display indicators such as response times, throughput, error rates and transaction duration.
4) Identify Unusual Behaviour: Monitoring rules and supported anomaly detection features highlight performance changes that may require investigation.
5) Generate Alerts: Teams receive notifications when defined thresholds or monitoring conditions are triggered.
6) Analyse Transactions: Distributed tracing helps teams follow requests across instrumented services and identify where delays or failures occur.
7) Investigate Performance Bottlenecks: Developers examine traces, metrics and relevant logs to identify potential causes of application problems.
8) Review Historical Trends: Historical performance data helps teams assess recurring problems, evaluate changes and plan future improvements.
Example: Investigating a Slow Checkout Process
Suppose an online shopping application normally processes a checkout request in approximately one second, but users begin experiencing response times of several seconds.An APM tool can help the team investigate the issue by:1. Detecting an increase in checkout request latency.2. Identifying the services involved in the checkout transaction.3. Examining traces to locate operations taking longer than expected.4. Checking database calls or external payment service requests.5. Comparing performance before and after a recent application change.These findings help developers narrow down the possible cause and decide which part of the application requires attention.
How to Choose the Right APM Tool?
Choosing an APM tool requires understanding your application's architecture, monitoring priorities and available resources. The following factors can help you evaluate different platforms:
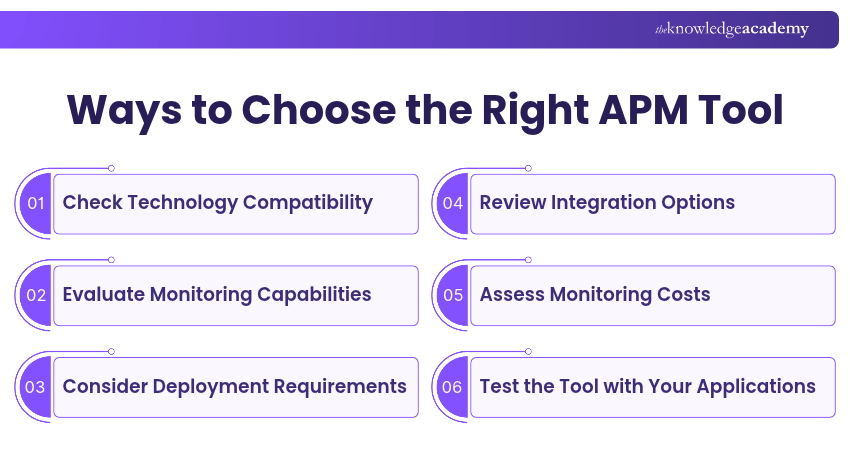
1) Check Technology Compatibility
Confirm that the tool supports your application's programming languages, frameworks, databases and deployment environment. Also review its instrumentation requirements and supported integrations.
2) Evaluate Monitoring Capabilities
Look for features relevant to your requirements, such as transaction monitoring, distributed tracing, error tracking, service maps and code-level diagnostics.
Some tools provide extensive application diagnostics, while others focus more on tracing or broader observability.
3) Consider Deployment Requirements
Decide whether you need a cloud-hosted platform, a self-hosted solution or support for hybrid environments. Your choice may depend on infrastructure requirements, operational resources and data residency policies.
4) Review Integration Options
Check whether the platform integrates with your existing monitoring systems, cloud services, incident management tools and development workflows.
OpenTelemetry support may help reduce dependence on proprietary instrumentation, although supported features and data formats can still vary between platforms.
5) Assess Monitoring Costs
Review how the vendor calculates costs. Pricing may depend on monitored hosts, containers, ingested telemetry, data retention, users or additional features.
Consider expected data volume and monitoring coverage rather than comparing subscription prices alone.
6) Test the Tool with Your Applications
Where possible, use a trial or proof of concept to assess installation requirements, monitoring accuracy, dashboard usability and troubleshooting capabilities.
Testing the tool against a real application can reveal limitations that may not be clear from product descriptions.
Test Your Knowledge: Can You Spot the Bottleneck?
Scenario: Users report intermittent delays when logging into an application, even though server CPU usage remains normal. What should the team investigate next?A) Increase the number of application servers immediately.B) Examine distributed traces and database calls.C) Disable application monitoring.Correct Answer: B) Examine distributed traces and database calls.Explanation: Normal CPU usage does not rule out application performance problems. Distributed traces can help teams investigate delays across authentication services, database queries and external dependencies before deciding on a solution.
Transform business requirements into functional and scalable system designs with our Systems Development Essentials Training – Register now!

The Knowledge Academy develops accessible learning content across Project Management, IT, Cybersecurity, Data Science, Business Analysis, HR, Accounting and Finance, Leadership and Health and Safety. Its resources combine subject research with clear explanations to help professionals build practical knowledge across a wide range of disciplines.
View Detail

 If you wish to make any changes to your course, please


