


We may not have the course you’re looking for. If you enquire or give us a call on 01344203999 and speak to our training experts, we may still be able to help with your training requirements.
Top 15 Data Science Skills and How to Improve Them
ByThe Knowledge AcademyLast updated on: 11 November 2026
Discover 15 essential data science skills, from Python, SQL and machine learning to communication and business acumen. Explore the technical and non-technical abilities Data Scientists use to analyse data, develop reliable models and support informed decisions.
Data Science Skills at a Glance
Successful Data Scientists combine different competencies to turn data into meaningful insights:1. Programming and Databases: Use Python, R and SQL to process and retrieve data.2. Statistical Analysis: Understand patterns, uncertainty and relationships within datasets.3. Data Preparation and Modelling: Clean information, explore patterns and develop predictive models.4. Model Operations: Evaluate, deploy and monitor models when required.5. Professional Skills: Communicate findings, solve problems and apply data responsibly.
Every click, purchase and online interaction generates data. But collecting information is only the beginning. The real challenge lies in finding patterns, understanding what they mean and using them to make smarter decisions. That's where the right data science skills make a difference.
From programming and statistical analysis to critical thinking and communication, data science brings technical expertise and professional judgement together. So, which skills should you focus on to build a strong foundation in this field? Let's get into the blog.
Top 15 Data Science Skills
Data science is the field of using scientific methods, statistics and technology to extract meaningful insights from data. Data Scientists use a combination of technical, analytical and interpersonal skills to collect, process and interpret data. While technical expertise helps them work with datasets and build models, non-technical abilities support problem-solving, collaboration and decision-making.

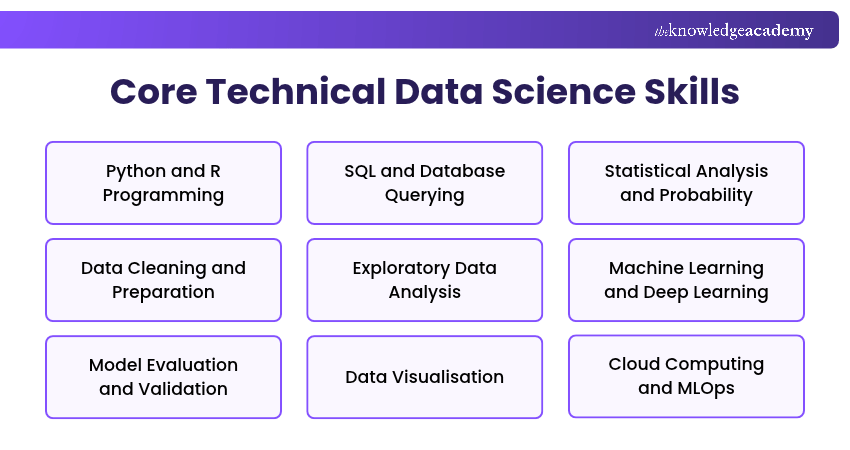
Core Technical Data Science Skills
Technical data science skills provide the foundation for working with datasets, applying statistical methods, developing machine learning models and managing analytical workflows. The following are some of the technical skills used in data science:
1) Python and R Programming
Programming enables Data Scientists to process information, perform calculations, automate tasks and develop analytical models.
Python is widely used for data analysis and machine learning, with libraries such as NumPy, pandas and scikit-learn supporting numerical computing, data manipulation and modelling. R is useful for statistical analysis and visualisation through packages such as dplyr and ggplot2.
Key Applications:
1) Data Processing: Write scripts to organise and transform datasets.
2) Statistical Analysis: Apply calculations and analytical methods.
3) Machine Learning: Develop and test predictive models.
4) Automation: Reduce repetitive data-processing tasks.
2) SQL and Database Querying
SQL (Structured Query Language) helps Data Scientists retrieve, filter, combine and summarise information stored in relational databases. Understanding database structures and relationships also helps them prepare datasets for analysis.
For example, a retail business may store customer details, purchases and product information in separate tables. SQL queries can combine these records to examine purchasing patterns.
Key Applications:
1) Data Retrieval: Extract information using SQL queries.
2) Filtering and Sorting: Filter records based on specific conditions and arrange query results in a required order.
3) Table Joins: Combine related information from multiple tables.
4) Data Aggregation: Calculate totals, averages and other summaries.
3) Statistical Analysis and Probability
Statistical analysis and probability help Data Scientists identify patterns, evaluate uncertainty and draw evidence-based conclusions. They support hypothesis testing, statistical inference and the interpretation of analytical results.
Statistical methods help measure relationships and estimate population characteristics, while probability helps quantify uncertainty in forecasting and risk assessment.
Key Applications:
1) Descriptive Statistics: Summarise datasets using measures such as mean, median and standard deviation.
2) Hypothesis Testing: Evaluate statistical evidence concerning proposed hypotheses.
3) Probability Analysis: Estimate the likelihood of possible outcomes under stated assumptions.
4) Statistical Inference: Draw conclusions about populations using appropriate samples and methods.
Attain in-depth knowledge of random variables and multivariate random variables with our Probability and Statistics for Data Science Training – Join now!
4) Data Cleaning and Preparation
Data cleaning and preparation involve identifying and addressing issues that could affect analytical results. Real-world datasets may contain missing values, duplicates, inconsistent formats and incorrect entries.
Data Scientists examine these issues and apply suitable methods, such as standardising values, correcting formatting errors, removing confirmed duplicates and handling missing data according to project requirements.
Key Applications:
1) Missing Data Handling: Identify missing values and choose suitable treatment methods.
2) Duplicate Detection: Find and address repeated records.
3) Data Transformation: Convert values into appropriate formats and structures.
4) Quality Checking: Examine inconsistencies, invalid entries and unexpected values.
5) Exploratory Data Analysis
Exploratory Data Analysis (EDA) involves examining datasets to understand their characteristics before and during further statistical analysis or modelling.
Data Scientists use EDA to investigate distributions, relationships, unusual observations and possible trends. Techniques include summary statistics, frequency tables, scatter plots, histograms and correlation analysis.
Key Applications:
1) Distribution Analysis: Examine how values are spread across a dataset.
2) Relationship Exploration: Investigate associations between variables.
3) Outlier Investigation: Identify unusual observations and assess their possible causes.
4) Pattern Discovery: Explore trends and generate questions for further analysis.
Worked Example: Investigating Retail Sales
Imagine a retailer notices a decline in sales. A Data Scientist could clean the transaction records and use EDA to compare sales across months, product categories and store locations.The analysis might reveal that sales have fallen mainly in one product category, helping identify where further investigation is needed.
6) Machine Learning and Deep Learning
Machine Learning (ML) is a branch of Artificial Intelligence (AI) that uses algorithms to identify patterns in data and generate predictions, classifications or other outputs without requiring every rule to be explicitly programmed. It supports applications such as forecasting, classification and recommendation systems.
Deep learning is a specialised area of machine learning that uses multilayer neural networks to process complex patterns in images, speech and language.
Generative AI and Large Language Models (LLMs) also rely extensively on deep learning. Understanding their capabilities, limitations and evaluation methods is particularly useful for AI-focused data science roles.
Key Applications:
1) Predictive Modelling: Estimate future outcomes using historical data.
2) Classification: Assign observations to defined categories.
3) Recommendation Systems: Suggest relevant items based on observed patterns.
4) Deep Learning Applications: Develop systems for tasks such as image recognition and language processing.
7) Model Evaluation and Validation
Model evaluation and validation help Data Scientists assess model performance, test generalisation to unseen data and determine whether a model meets the requirements of its intended application.
A model may produce impressive results on the information used during training but perform poorly when applied to new observations. Data Scientists therefore use suitable evaluation methods, including validation datasets and cross-validation.
The choice of performance metrics depends on the problem. Classification models may be assessed using precision, recall and F1-score, while regression models may be evaluated using measures such as Mean Absolute Error (MAE) or Root Mean Squared Error (RMSE).
Key Applications:
1) Performance Measurement: Select metrics appropriate to the task.
2) Cross-validation: Evaluate model performance across different training and validation splits.
3) Overfitting Detection: Identify when a model fits training data but generalises poorly.
4) Model Comparison: Compare alternatives using consistent evaluation procedures.
Trainer's Insight: Avoid Data Leakage
A model may appear highly accurate when information from validation or test data influences its development. Split the data appropriately and fit preprocessing transformations using only the relevant training data. This helps prevent data leakage and produces more reliable performance estimates.
8) Data Visualisation
Data visualisation presents information through charts, graphs, maps and dashboards, helping Data Scientists identify patterns and communicate findings.
Effective visualisation requires suitable chart types, accurate scales and clear presentation to avoid misleading interpretations. Tools such as Matplotlib, Seaborn, ggplot2, Tableau and Power BI support different visualisation needs.
Key Applications:
1) Trend Analysis: Display changes over time using suitable charts.
2) Relationship Exploration: Visualise associations between variables.
3) Dashboard Development: Present selected performance indicators and analytical findings.
4) Data Storytelling: Explain insights clearly to technical and non-technical audiences.
Learn about how data visualisation is used for business decision-making with our Data Analysis and Visualisation with Python Training – Register now!
9) Cloud Computing and MLOps
Cloud computing provides access to computing, storage and analytical services without requiring organisations to manage all infrastructure locally.
Data Scientists may use cloud platforms such as Amazon Web Services (AWS), Microsoft Azure and Google Cloud to process large datasets, train models and collaborate on analytical projects.
MLOps, short for Machine Learning Operations, focuses on managing the lifecycle of machine learning systems. It includes practices such as versioning, deployment, monitoring, reproducibility, automated testing and maintaining models after release.
These capabilities are particularly valuable for Data Scientists working with production machine learning systems, although not every role requires advanced MLOps expertise.
Key Applications:
1) Scalable Computing: Access resources for processing data and training models.
2) Model Deployment: Make trained models available to applications or users.
3) Version Control: Track changes to code, models and related artefacts.
4) Model Monitoring: Track model performance, data changes and operational issues after deployment.
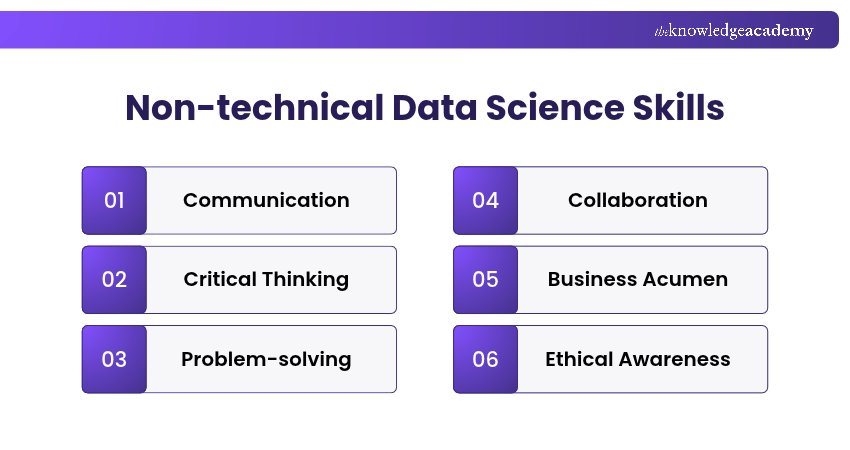
Non-technical Data Science Skills
Technical knowledge alone is not sufficient to deliver useful analytical work. Data Scientists must also understand problems, communicate findings, collaborate with others and consider the consequences of their work.
10) Communication
Communication helps Data Scientists explain complex analytical findings to colleagues, managers and other stakeholders. Their audience may include people with little programming or statistical knowledge, so explanations should be clear and relevant.
Effective communication involves describing the purpose of an analysis, presenting important findings and explaining limitations or uncertainties.
For example, rather than presenting only a model's performance score, a Data Scientist might explain what the results mean for business decisions and where further investigation is needed.
11) Critical Thinking
Critical thinking involves examining information carefully, questioning assumptions and evaluating whether conclusions are supported by evidence.
Data Scientists use this skill to assess data sources, select analytical methods and interpret findings in context. It also helps them recognise when an apparent relationship may have another explanation.
For example, an increase in sales occurring alongside increased advertising does not necessarily prove that advertising caused the improvement. Other factors, such as seasonal demand, may also be involved.
12) Problem-solving
Problem-solving helps Data Scientists break complex questions into manageable analytical tasks. It involves defining problems, exploring approaches, testing solutions and reviewing results, particularly when data is incomplete or requirements are unclear.
For example, when customer cancellations increase, a Data Scientist may investigate factors such as declining engagement, recurring complaints and subscription changes to identify patterns that could inform retention strategies.
13) Collaboration
Data science projects often require cooperation between Data Scientists, Data Engineers, Software Developers, business teams and other stakeholders.
Collaboration helps professionals understand requirements, share knowledge and coordinate tasks throughout a project. It also involves listening to different perspectives, incorporating feedback and communicating dependencies.
For example, a Data Scientist developing a forecasting model may work with Data Engineers to obtain reliable data and with business teams to understand how the predictions will be used.
14) Business Acumen
Business acumen helps Data Scientists understand organisational objectives and connect analytical findings to practical decisions. It involves identifying relevant business problems, performance indicators and operational priorities.
For example, an accurate sales forecast may offer limited value unless it helps an organisation make informed decisions about inventory, staffing or resources.
15) Ethical Awareness
Ethical awareness involves using data responsibly and considering how analytical methods and automated decisions may affect individuals and organisations.
Data Scientists should understand issues such as privacy, consent where relevant, data security, bias, fairness and transparency. They also need to recognise the limitations of datasets and models, particularly when outputs may influence important decisions.
For example, a model used to support recruitment decisions should be evaluated for potential unfair outcomes and should not be treated as reliable simply because its overall accuracy is high. Such systems also require appropriate human oversight, transparency and ongoing evaluation.
A Practical Portfolio Challenge: Predict Customer Churn
Create a small project using a suitable, legitimately obtained customer dataset.
1) Define the Question: Identify what customer churn means and what the project aims to predict.
2) Prepare the Data: Examine missing values, inconsistent records and data quality issues.
3) Explore Patterns: Investigate relevant customer characteristics and relationships.
4) Build a Model: Select an appropriate baseline model and compare it with alternatives.
5) Evaluate the Results: Use metrics appropriate to the problem, such as precision, recall and F1-score for churn classification, while avoiding data leakage.
6) Explain the Findings: Present the results, limitations and potential business implications.
This project combines several data science skills in one practical exercise.
Develop skills in data collection, predictive analytics and data-driven decision-making with our Data Science Analytics Training – Register today!
How to Improve Your Data Science Skills?
Developing data science skills requires more than learning theoretical concepts. Regular practice, relevant projects and constructive feedback help learners apply what they know and identify areas for improvement.
Here are six practical ways to strengthen your data science abilities:
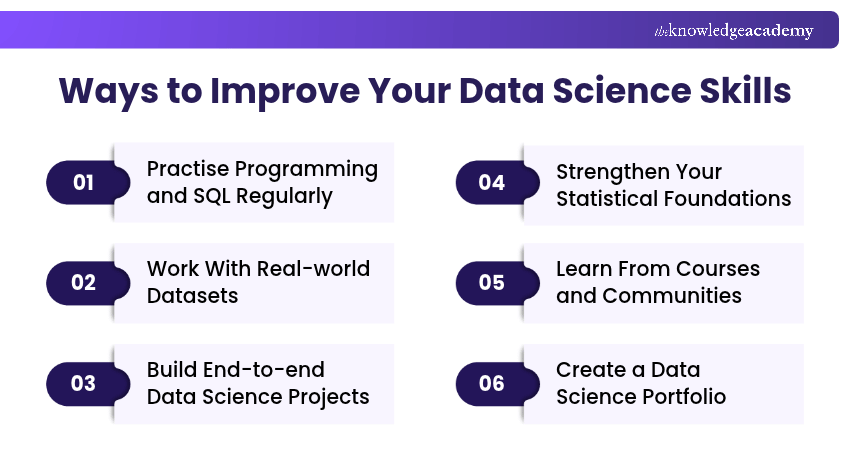
1) Practise Programming and SQL Regularly: Work with Python or R to process datasets, perform calculations and create visualisations. Practise SQL queries involving filtering, joins and aggregation to strengthen your understanding of structured data.
2) Work With Real-world Datasets: Explore publicly available datasets from sources such as the UK Office for National Statistics (ONS), data.gov.uk or other reputable repositories. Practise cleaning records, investigating patterns and communicating findings. Always review the dataset's licence and handling requirements.
3) Build End-to-end Data Science Projects: Develop projects that involve defining a problem, preparing data, exploring patterns, selecting analytical methods and evaluating results. Document your decisions and limitations so others can understand your approach.
4) Strengthen Your Statistical Foundations: Practise concepts such as probability distributions, sampling, confidence intervals and hypothesis testing. Apply them to datasets rather than relying only on definitions.
5) Learn From Courses and Communities: Use structured learning resources, technical documentation and practical tutorials. Participate in communities such as Kaggle, attend workshops and exchange feedback with other learners or professionals.
6) Create a Data Science Portfolio: Organise completed projects using tools such as GitHub. Include clear project descriptions, appropriate code, visualisations and explanations of what the findings mean. Avoid publishing confidential or sensitive information.
Pro Tip: Finish Before You Expand
Instead of starting several projects at once, complete one manageable data science project and document your findings. Focus on explaining your decisions, results and limitations before moving to a more complex challenge.
Understand advanced data science concepts and methodologies with our Advanced Data Science Certification Training – Join now!

The Knowledge Academy develops accessible learning content across Project Management, IT, Cybersecurity, Data Science, Business Analysis, HR, Accounting and Finance, Leadership and Health and Safety. Its resources combine subject research with clear explanations to help professionals build practical knowledge across a wide range of disciplines.
View Detail

 If you wish to make any changes to your course, please


