




We may not have the course you’re looking for. If you enquire or give us a call on 01344203999 and speak to our training experts, we may still be able to help with your training requirements.
What is a Flowchart: Types, Uses and Benefits
ByThe Knowledge AcademyLast updated on: 19 August 2026
A Flowchart visually maps how a process moves from one step or decision to another. This blog explores its symbols, types, uses, benefits and how to create one effectively.

Key Takeaways
1. Flowcharts use symbols and arrows to visually map processes and decisions.2. Common symbols represent processes, decisions, inputs, outputs and endpoints.3. Different Flowchart types suit different processes, systems and responsibilities.4. Effective Flowcharts depend on logical sequencing, consistent symbols and clear connections.5. Flowcharts improve process visibility but can become difficult to manage when overly complex.
Before reading further, see how much of this you can understand at a glance:
○ Start▭ Take Action◇ Make a Choice→ See What Happens Next
You probably did not need much explanation to understand the basic journey. A few simple visual cues were enough to show where something begins, what happens next and where a decision can change the direction.
That is exactly what makes Flowcharts powerful. They turn steps, decisions and connections into a visual path that is easier to follow than lengthy instructions. Understanding What is a Flowchart starts with recognising how this visual language simplifies processes, communicates ideas clearly and makes complex workflows easier to navigate.
What is a Flowchart?
A Flowchart is a visual diagram that represents the sequence of steps, decisions or activities within a process, workflow or system. It uses shapes, arrows and connecting lines to show how one stage leads to another.
Instead of describing a process entirely through written instructions, a Flowchart presents it visually. This can make complex information easier to understand, communicate and analyse. Flowcharts are commonly used to document procedures, map workflows, explain program logic and support process improvement.
Trainer Insight: Before creating a Flowchart, define the question it needs to answer. A clear purpose makes it easier to decide what information should be included and prevents the diagram from becoming unnecessarily complicated.

Common Flowchart Symbols and Their Meanings
Flowcharts use different shapes to represent different elements of a process. Although the symbols used can vary depending on the type and purpose of the diagram, several symbols are commonly recognised.
|
Symbol
|
Meaning
|
Purpose
|
|
Oval/Terminator
|
Start or End
|
Shows where a process begins or finishes
|
|
Rectangle
|
Process
|
Represents an action, task or operation
|
|
Diamond
|
Decision
|
Shows where a process can follow different paths
|
|
Parallelogram
|
Input/Output
|
Represents information entering or leaving a process
|
|
Arrow/Flow Line
|
Direction
|
Shows the sequence and direction of the process
|
|
Connector
|
Connection
|
Links different sections of a Flowchart
|
Using symbols consistently helps readers understand the diagram without needing lengthy explanations.
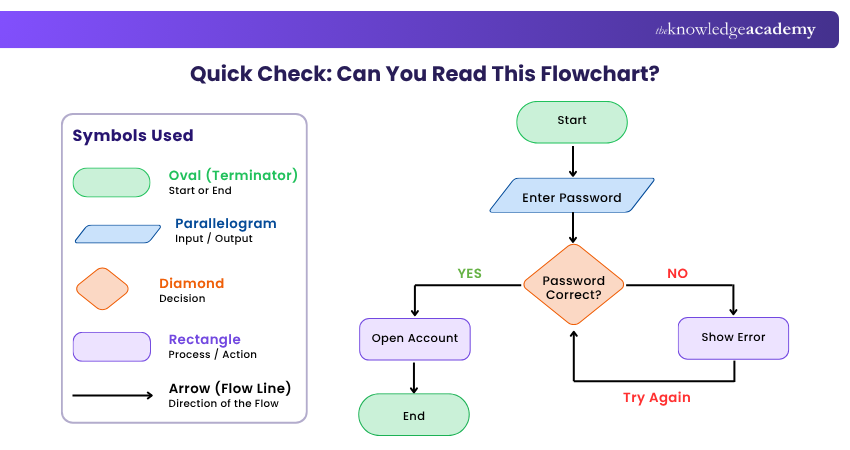
Quick Check: A reader should be able to identify where the process starts, what happens next, where decisions occur and where the process ends.
How Does a Flowchart Work?
A Flowchart works by guiding the reader through a process in a logical sequence. It normally begins with a start point and uses arrows to connect actions, decisions and other stages until an end point is reached.
For a straightforward process, the path may move directly from one activity to another. More complex Flowcharts can contain decision points where the path branches depending on an answer or condition.
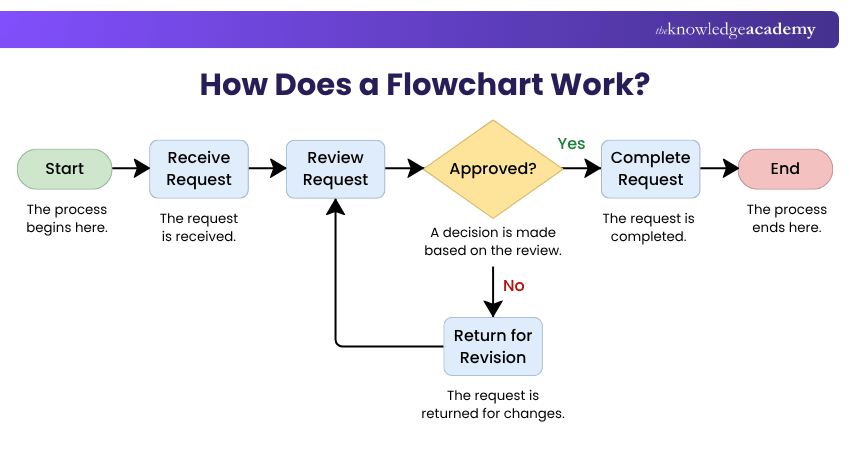
The Flowchart above shows how a process moves from one step to another using arrows. At the decision point, the process branches into different paths depending on the outcome.
Common Types of Flowcharts
Different Flowcharts are suited to different purposes. Some focus on sequential activities, while others emphasise decisions, responsibilities, documents or technical systems.
Note: Flowchart categories can overlap, and terminology may vary between organisations and modelling approaches. For example, Process, Workflow and Business Process Flowcharts may describe similar diagrams depending on their purpose and level of detail.
1) Process Flowchart
A Process Flowchart shows the sequence of steps involved in completing a process from start to finish. It is commonly used to document procedures and routine workflows.
Best For: Sequential processes and documenting Standard Operating Procedures (SOPs).
Example: Showing an order process from receiving the order to payment, packing and dispatch.
2) Decision Flowchart
A Decision Flowchart shows how a process follows different paths based on specific decisions or conditions. Decision points usually lead to two or more possible outcomes.
Best For: Processes involving choices, conditions or multiple outcomes.
Example: Showing whether a loan application should be approved, rejected or sent for further review.
3) Swimlane Flowchart
A Swimlane Flowchart divides a process into separate lanes for people, teams or departments. This makes it easier to see who performs each task and where responsibilities move between participants.
Best For: Cross-functional processes involving multiple roles or departments.
Example: Showing an employee onboarding process involving HR, the hiring manager, IT and the new employee.
4) Document Flowchart
A Document Flowchart shows how documents or information move between people, departments and stages of a process. It can include creation, review, approval, storage and distribution.
Best For: Document handling and approval processes.
Example: Showing how an invoice moves from submission and approval to payment and record keeping.
5) System Flowchart
A System Flowchart provides a visual overview of how different parts of a system work together. It can represent inputs, processes, outputs, storage and interactions between system components.
Best For: Understanding and documenting system operations.
Example: Showing how customer information moves from an online application to a server, database and final output.
6) Program Flowchart
A Program Flowchart represents the logical sequence of operations within a computer program or algorithm. It can show processing steps, decisions, loops and different paths through the program.
Best For: Explaining algorithms and program logic.
Example: Showing the logic of a login process that checks a username and password before granting or denying access.
7) Workflow Flowchart
A Workflow Flowchart shows how tasks move through different stages of a workflow. It focuses on the progression of work and how one activity leads to the next.
Best For: Routine operational and administrative workflows.
Example: Showing how a customer support ticket moves from submission and assignment to investigation and resolution.
8) Business Process Flowchart
A Business Process Flowchart maps the activities involved in completing a business process. It provides an end-to-end view that can help teams understand how different activities connect.
Best For: Business operations and process analysis.
Example: Showing an order fulfilment process from receiving a customer order through processing, dispatch and delivery.
Important: Not every diagram that shows a flow is technically the same as a Flowchart. Data Flow Diagrams (DFDs), PERT Charts and Event-driven Process Chains (EPCs), for example, are related visual modelling techniques with their own purposes and conventions.
Learn to transform raw data into visually interactive dashboards and insightful reports with our Microsoft Power BI Training – Sign up now!
How to Create a Flowchart
Creating an effective Flowchart starts with understanding the process rather than immediately drawing shapes. Follow these steps:
1) Define the Purpose and Scope
Decide what the Flowchart needs to explain and who will use it. Set clear boundaries for where the process starts and ends so the diagram remains focused.
2) Identify the Main Steps
List the activities, decisions, inputs and outputs that need to appear. Keep only information that contributes to understanding the process.
3) Arrange the Steps
Place the steps in their logical order, starting with the beginning of the process and continuing towards the final outcome.
4) Select the Appropriate Symbols
Use consistent Flowchart symbols for processes, decisions, inputs, outputs and start or end points.
5) Connect the Steps
Use arrows to show how the process moves from one stage to another. Decision points should clearly indicate the possible paths.
6) Review the Flowchart
Follow every path from start to finish. Check that no steps are missing, decision branches are clearly labelled and the diagram accurately reflects the process.
Pro Tip: Do not add detail simply to make a Flowchart look comprehensive. A simple diagram that communicates the process clearly is often more useful than a complicated one containing unnecessary steps.
Common Uses of Flowcharts
Flowcharts are flexible and can be applied across technical and non-technical environments. Some common uses include:
1) Process Documentation
Organisations can use Flowcharts to record how routine activities and procedures are performed.
2) Process Analysis
Mapping a process visually can make unnecessary steps, delays, repeated activities or unclear handoffs easier to identify.
3) Decision-making
Decision Flowcharts can show available choices and the possible paths associated with different conditions.
4) Project Planning
Flowcharts can help teams visualise sequences of activities and understand how different stages of work connect.
5) Software Development
Developers can use Program Flowcharts to represent algorithms, conditions and logical sequences before or during development.
6) Training and Communication
A visual process can sometimes be easier for employees or stakeholders to follow than lengthy written instructions.
7) Business Process Management
Teams can use Flowcharts to examine end-to-end business processes, clarify responsibilities and handoffs and identify opportunities for redesign or continuous improvement.
Learn best practices for creating and managing dashboards with our Grafana Training – Register now!
Benefits and Limitations of Flowcharts
Flowcharts provide a simple way to communicate processes visually, but they are not suitable for every situation. Understanding both their strengths and limitations helps determine when they are most useful.
Benefits of Flowcharts
1) Simplifies Complex Processes: Flowcharts break complicated processes into clear visual steps, making them easier to understand and follow.
2) Improves Communication: They provide teams and stakeholders with a shared visual understanding of how a process works.
3) Supports Process Improvement: By making the entire process visible, Flowcharts can help teams identify opportunities to simplify workflows, remove inefficiencies and improve coordination.
4) Creates Clearer Documentation: Flowcharts provide a structured visual record of procedures and workflows that teams can use for reference, training and review.
5) Supports Training: Flowcharts can help explain processes to new employees or stakeholders without relying entirely on lengthy written instructions.
Limitations of Flowcharts
1) Can Become Complex: Large processes with many steps and decision points can result in crowded and difficult-to-read Flowcharts.
2) Requires Regular Updates: Flowcharts can become outdated when the underlying process changes, so they need to be reviewed periodically to remain accurate.
3) Can Be Time-consuming to Maintain: Large or highly detailed Flowcharts can require significant effort to revise, validate and redistribute when changes occur.
4) May Oversimplify Processes: A simple Flowchart may not capture every exception, dependency or complex relationship.
5) Depends on Clear Design: Inconsistent symbols, unclear arrows or excessive detail can make a Flowchart confusing rather than helpful.
Trainer Insight: A Flowchart should make a process easier to understand. If readers need a long explanation just to interpret the diagram, consider simplifying it or dividing it into smaller Flowcharts.
Conclusion
Understanding What is a Flowchart makes it easier to see how complex processes can be transformed into clear visual paths. The real value lies not in using more shapes or adding more detail, but in presenting the right information clearly. With suitable symbols, logical connections and a focused structure, Flowcharts can make processes easier to explain, analyse and improve.
Understand key concepts in data modelling and effective database handling with the Business Intelligence Reporting Training – Join now!

The Knowledge Academy develops accessible learning content across Project Management, IT, Cybersecurity, Data Science, Business Analysis, HR, Accounting and Finance, Leadership and Health and Safety. Its resources combine subject research with clear explanations to help professionals build practical knowledge across a wide range of disciplines.
View Detail

 If you wish to make any changes to your course, please


