




We may not have the course you’re looking for. If you enquire or give us a call on 01344203999 and speak to our training experts, we may still be able to help with your training requirements.
Types of Data in Statistics: Explained with Examples
ByThe Knowledge AcademyLast updated on: 02 October 2026
This blog explores the different types of data in statistics, from qualitative and quantitative data to discrete and continuous values, along with how identifying the correct type shapes analysis and interpretation.
In This Blog
1. Statistical data can be classified according to its nature and level of measurement.2. Qualitative data represents categories, while quantitative data represents numerical quantities or measurements.3. Quantitative data can be discrete when values are counted or continuous when values are measured.4. Nominal and ordinal data represent the two main types of qualitative data, distinguished by whether the categories have a meaningful order.5. Identifying the correct data type helps you choose suitable statistical methods, comparisons, and visualisations.
Data is central to statistical analysis and decision-making. It provides the foundation for identifying patterns, examining relationships, and drawing meaningful conclusions. However, not every piece of data can be treated in the same way.
Understanding the types of data in statistics helps you determine what information represents and how it can be analysed. Whether it's a customer's preferred colour or their exact height in centimetres, the type of data behind that information determines what you can actually do with it, and recognising the difference is the first step in any statistical analysis.
Different Types of Data in Statistics
The following are the different types of data in statistics:
1) Qualitative Data
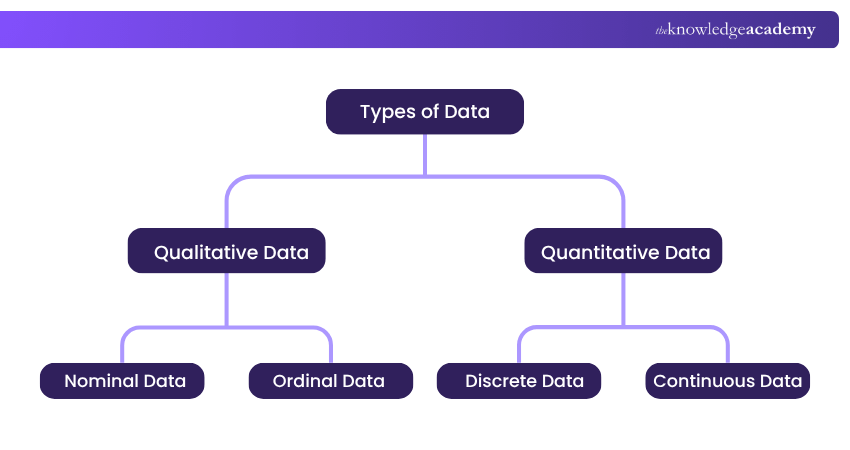
Qualitative data, or categorical data, is crucial in capturing non-numerical information. It's a valuable form of data that helps classify and categorise elements into distinct groups, providing valuable insights into various aspects of research and analysis. Two primary subtypes of qualitative data are nominal and ordinal data.
Nominal Data
Nominal data represents categories or labels without any inherent order or ranking. These categories serve as identifiers, allowing us to group data into discrete classes. Nominal data is characterised by its distinct and unrelated categories, and it's often used for classifying data based on attributes. Here are a few key features of nominal data:
a) No Order: The categories in nominal data have no specific order or ranking. For example, if we're categorising types of fruits as apples, oranges, and bananas, these categories have equal standing and do not imply any inherent order.
b) Distinct Labels: Each category in nominal data is distinctly labelled, making identifying and classifying elements easy.
Examples:
a) Types of Pets: e.g., dogs, cats, birds
b) Marital Status: e.g., married, single, divorced
c) Colours: e.g., red, blue, green
Nominal data is often analysed using frequency tables and bar charts, making it helpful in summarising and visualising categorical information.
Ordinal Data
Ordinal data, on the other hand, represents categories or labels with a meaningful order or ranking. Ordinal data adds a layer of information by indicating that one category is "greater" or "better" than another. However, it's important to note that the intervals between these categories are not necessarily equal. Key characteristics of ordinal data include:
a) Order: The categories in ordinal data have a specific order or ranking, reflecting a progression from a lower to a higher state. For example, in a survey that collects customer satisfaction ratings ranging from "very dissatisfied" to "very satisfied," the order is evident.
b) Non-equidistant Intervals: Unlike interval or ratio data, ordinal data does not have equal gaps between categories. The difference between categories may vary.
Examples:
a) Educational Levels: e.g., elementary, high school, college
b) Socioeconomic Status: e.g., low-income, middle-income, high-income
c) Movie Ratings: e.g., one star, two stars, three stars

Pro Tip
A number does not automatically make data quantitative. If numbers are simply used as category labels, such as 1 = North and 2 = South, they still represent categorical data.
2) Quantitative Data
Quantitative data is a fundamental component of statistics, providing a numerical foundation for analysis and decision-making. It includes a wide range of numerical values that represent quantities, measurements, and observations. Two primary categories within quantitative data are discrete data and continuous data.
Discrete Data
Discrete data consists of countable, distinct values that are often whole numbers and cannot be broken down into smaller parts. These values result from counting or enumerating items or occurrences. Discrete data is prevalent in various fields and applications, including business, science, and social sciences. Key characteristics of discrete data are:
a) Countable Values: Discrete data consists of values that are distinct and countable. This means you can list or enumerate all the possible values within the dataset.
b) Gaps Between Values: In a Discrete dataset, apparent gaps or intervals exist between the values. These gaps indicate that there are no values between the specified data points.
Examples of Discrete Data:
a) Number of Customers: In retail, businesses track the number of customers entering their stores daily. This count yields discrete data, as you cannot have a fraction of a customer.
b) Student Grades: Grading systems typically use discrete values such as A, B, C, D, and F to represent academic performance. Each grade represents a distinct category.
c) Dice Rolls: When rolling a six-sided dice, the possible outcomes are discrete and countable, ranging from 1 to 6.
Trainer's
Think "count" versus "measure". Values obtained by counting are often discrete, while values obtained through measurement are commonly continuous.
Continuous Data
Continuous data, in contrast, represents measurements that can take on an infinite number of values within a given range. These values are typically expressed as decimals or fractions and can be divided into smaller and smaller intervals. Continuous data is essential in scientific research, engineering, and numerous other fields where precision and accuracy are crucial. Continuous data is characterised by two key features:
a) Infinite Possible Values: Continuous data can take on infinite values within a given range. This means that there are countless other potential values between any two data points.
b) No gaps or Discontinuities: Continuous data has no gaps, breaks, or discontinuities between values. In other words, it can be measured with great precision, and there are no distinct, separate categories or intervals.
Examples of Continuous Data:
a) Height of Individuals: Heights can vary continuously, from fractions of an inch to several feet. Measuring the height of people yields continuous data.
b) Temperature Readings: Temperature measurements can include decimal values and vary continuously, ranging from below freezing to triple digits above zero.
c) Weight of Products: In manufacturing and commerce, the weight of products is often measured with precision, resulting in continuous data.
Continuous data is typically analysed using statistical techniques for continuous variables, such as histograms, scatter plots, and probability density functions. These methods help to visualise and analyse data with infinite possible values within a specified range. Regression analysis can provide further insights into how to model and interpret the relationships between continuous variables, improving the accuracy of your data-driven decisions.
Quick Check
Can you identify the correct type?
□ Number of books on a shelf: Discrete□ Weight of a parcel: Continuous□ Number of website visitors: Discrete□ Time taken to complete a task: Continuous
Strengthen your statistical foundation and start analysing data with confidence. Sign up for the Probability and Statistics for Data Science Training now!
Importance of Qualitative and Quantitative Data
Qualitative and quantitative data are two distinct but equally valuable types of information that play crucial roles in various fields, from scientific research to business decision-making. Each type offers unique insights and benefits, making them indispensable tools for understanding the world around us.
1) Qualitative Data
The following are the importance of qualitative data:
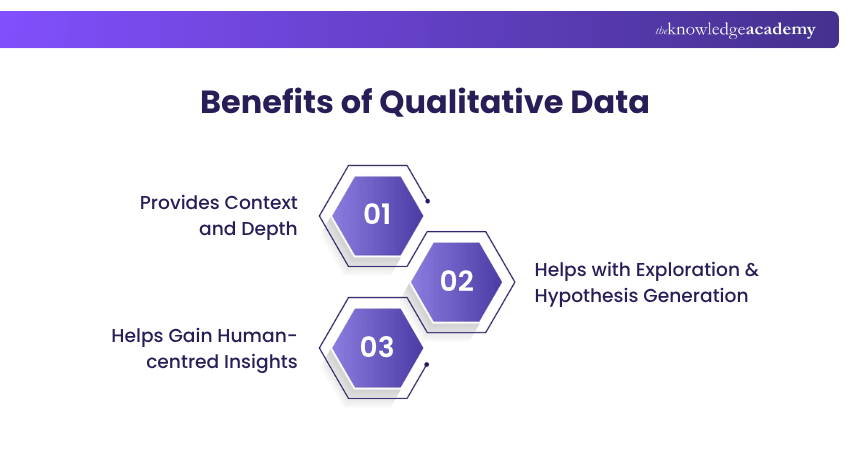
a) Context and Depth: Qualitative data provides context and a deeper understanding of complex phenomena. It captures the richness of human experiences, emotions, and behaviours, making it essential in Psychology, Sociology and Anthropology.
b) Exploration and Hypothesis Generation: It is often used to explore new topics and generate hypotheses. Researchers can use qualitative data to uncover trends, patterns, and potential relationships that may later be tested quantitatively.
c) Human-centred Insights: In business and marketing, qualitative data helps organisations gain insights into customer preferences, motivations, and pain points. It aids in designing products and services that align with customer needs.
2) Quantitative Data
The following are the importance of quantitative data:
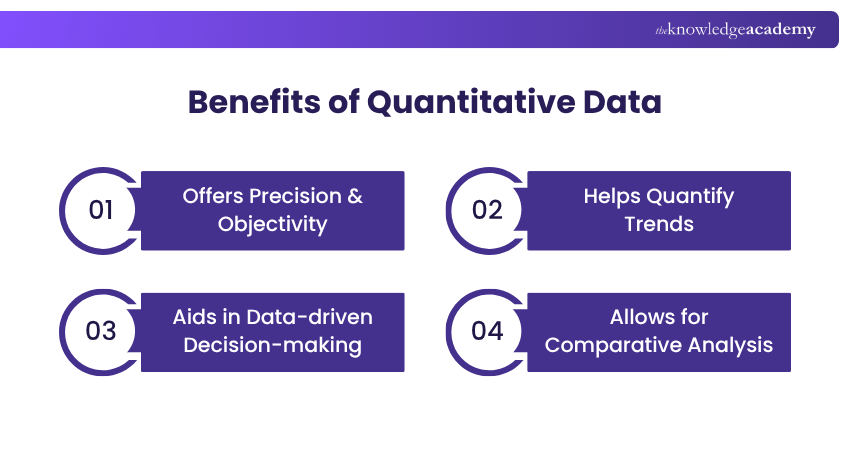
a) Precision and Objectivity: Quantitative data offers precision and objectivity. It provides numeric measurements that can be analysed statistically, allowing for rigorous testing of hypotheses and drawing statistically significant conclusions.
b) Quantifiable Trends: In fields like microeconomics, economics, medicine, and environmental science, quantitative data helps track trends over time, making it possible to identify patterns, make predictions, and assess the impact of interventions.
c) Data-driven Decision-making: In business and government, quantitative data guides data-driven decision-making. It aids in evaluating the effectiveness of policies, optimising processes, and measuring performance.
d) Comparative Analysis: Quantitative data allows for comparative analysis, enabling researchers to assess the relationships between variables and figure out the strength and direction of those relationships.
Unlock the power of R programming with Data Science with R Training – Register today and transform your career!
Difference Between Qualitative and Quantitative Data
Qualitative and quantitative data are the two fundamental types of data used in various fields, including science, social sciences, business, and statistics. They differ in nature, purpose, and the methods used for collection and analysis. Understanding the distinctions between these two types of data in statistics is crucial for researchers and analysts to choose appropriate approaches for their investigations.
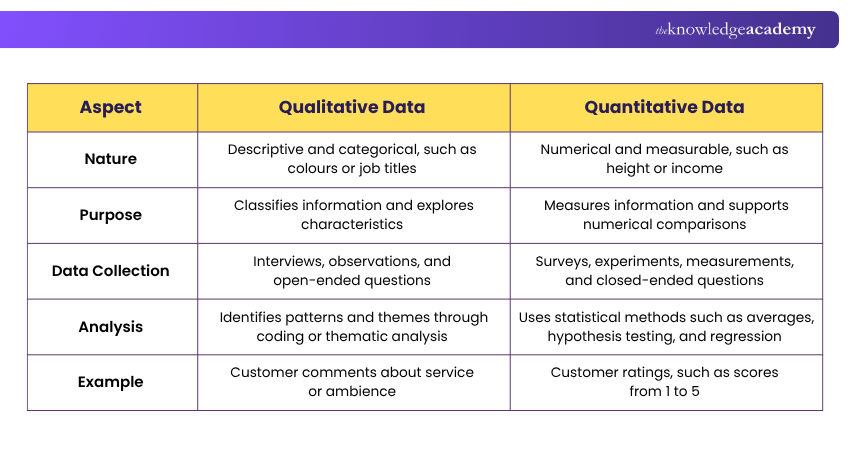
1) Nature
a) Qualitative Data: Qualitative data, also known as categorical data, is descriptive in nature. It deals with non-numeric information that can be categorised into groups or classes. Qualitative data often involves attributes, characteristics, or qualities. Examples include colours, types of animals, and job titles.
b) Quantitative Data: Quantitative data, in contrast, is numeric and measurable. It represents quantities, counts, or measurements and can be expressed numerically. Examples include height, temperature, income, and the number of products sold.
2) Purpose
a) Qualitative Data: Qualitative data is primarily used for classification and categorisation. It helps researchers understand the characteristics or attributes of items under study.
b) Quantitative Data: Quantitative data is focused on quantifying and measuring phenomena. It allows researchers to perform mathematical and statistical analyses, enabling precise comparisons, predictions, and hypothesis testing.
3) Data collection
a) Qualitative Data: Qualitative data is collected through interviews, surveys, observations, and content analysis. Researchers often use open-ended questions to gather rich, narrative responses that can be categorised later.
b) Quantitative Data: Quantitative data is typically collected using structured surveys, experiments, measurements, and numerical instruments. Closed-ended questions and standardised measurements are common in Quantitative data collection.
4) Analysis
a) Qualitative Data: Qualitative data analysis involves identifying patterns, themes, and trends through coding, content analysis, and thematic analysis. It requires a more subjective interpretation of data.
b) Quantitative Data: Quantitative data analysis employs statistical methods to analyse data, including measures of central tendency, dispersion, hypothesis testing, and regression analysis. It provides objective and numerical insights into the data.
5) Example
To illustrate the difference, consider a study on customer feedback for a restaurant:
Qualitative data might include customer comments about the restaurant's ambience, service, or menu. Researchers would categorise these comments into themes like "positive feedback," "complaints," or "suggestions."
Quantitative data would involve collecting numerical ratings (e.g., on a scale of 1 to 5) for various aspects of the restaurant, such as food quality, service speed, and cleanliness. Researchers could then calculate average ratings and conduct statistical analyses to identify areas for improvement.
Quick Checklist: Have You Identified Your Data Correctly?
Before analysing your data, check the following:
□ Have I identified whether the data is categorical or numerical?□ If categorical, does it have a meaningful order?□ If numerical, is it counted or measured?□ Have I identified whether it is discrete or continuous?□ Have I determined its level of measurement?□ Are the intervals between values equal?□ Is there a meaningful true zero?□ Have I chosen a statistical method suitable for the data type and analysis goal?

The Knowledge Academy develops accessible learning content across Project Management, IT, Cybersecurity, Data Science, Business Analysis, HR, Accounting and Finance, Leadership and Health and Safety. Its resources combine subject research with clear explanations to help professionals build practical knowledge across a wide range of disciplines.
View Detail

 If you wish to make any changes to your course, please


