




We may not have the course you’re looking for. If you enquire or give us a call on +44 1344 203 999 and speak to our training experts, we may still be able to help with your training requirements.
What is Sprint Burndown Chart in Scrum?
ByNilotpal SarmahLast updated on: 03 October 2026
A burn-down chart is a graphical representation of work left to do versus time. It is often used in agile software development methodologies such as Scrum. It helps teams easily track sprint progress on a daily basis. The chart also highlights potential risks early and supports clear, data driven planning decisions.

At a Glance
1. A Sprint Burndown Chart shows work remaining against time during a Sprint.2. It commonly includes an ideal burndown line and an actual burndown line.3. Teams can use it to track progress, spot trends, and identify potential issues early.4. The chart should be updated throughout the Sprint, not created only at the end.5. It is a supporting Scrum tool, not a mandatory Scrum artefact.6. It works best when used for visibility and forecasting, rather than as a direct measure of team performance.
Professionals using the Scrum methodology often require tracking methods to measure their project’s state. They resort to extensive documentation, make notes, and whatnot! However, they forget to do the smart work; you know what it is. The answer is using sprint burndown charts.
These charts are essential components of Scrum Methodology, providing teams with a visual representation of their progress throughout a sprint. They serve as a guiding compass, enabling teams to track their daily progress, adjust their course when necessary, and ensure they're on track to meet sprint goals.
Understanding Sprint Burndown Chart in Scrum
The sprint burndown chart is a fundamental visual tool in the scrum framework, designed to provide teams with a clear and brief view of their progress during a sprint. This chart serves as a valuable instrument for tracking and managing work, promoting transparency, and helping teams achieve their sprint goals. Here's what an ideal sprint burndown chart looks like:
Additionally, the sprint burndown chart is a graph that plots the amount of work remaining on the vertical axis against the passage of time on the horizontal axis. The central idea is to illustrate how much work remains to be completed in a Sprint, typically measured in Story Points or other relevant units. This chart features two key Lines:
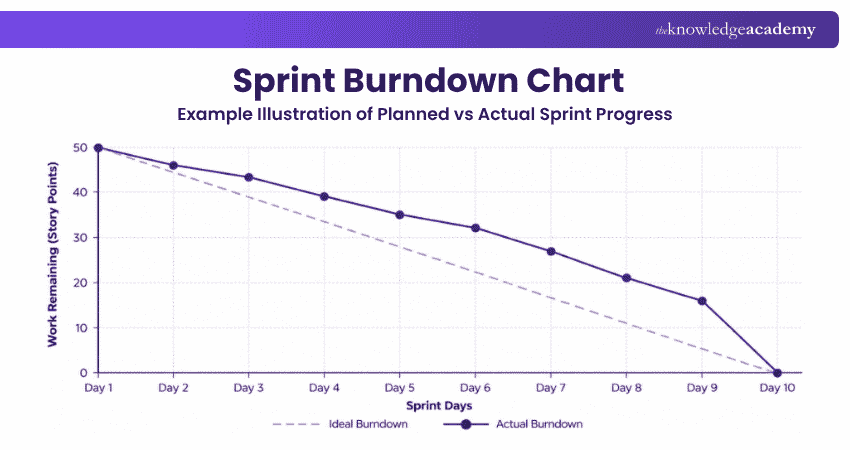
a) Ideal Burndown Line: This is a straight line connecting the total work at the start of the Sprint to zero work at the end, representing the planned rate of work completion. It serves as a benchmark for measuring the team's actual progress against the plan.
b) Actual Burndown Line: This line tracks the team's real progress, depicting how much work remains at each point in time during the Sprint. It is based on daily updates and helps in identifying deviations from the ideal path.
The sprint burndown chart plays a critical role in Scrum by offering real-time insights into the team's performance, encouraging collaboration, and facilitating quick responses to any issues or impediments that may arise during the Sprint. It is an essential tool for enhancing predictability and ensuring that Sprint's goals are met effectively and efficiently.

Steps to Create a Sprint Burndown Chart in Scrum
The sprint burndown chart in Scrum is a dynamic and versatile tool that serves several important functions throughout a Sprint. Here's a list of the key steps involved in creating and using this chart:
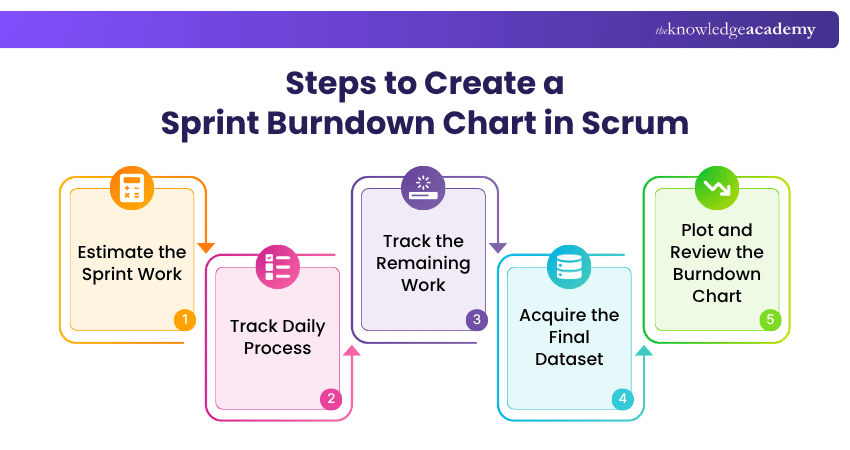
1) Estimate the Sprint Work
At the start of the Sprint, the team estimates the effort required for each item in the Sprint Backlog, typically using Story Points or other relevant units. These estimates are recorded as the initial "work remaining" for each task.
2) Track Daily Process
Every day during the Sprint, the team updates the sprint burndown chart. This involves reducing the work remaining for each task as they make progress. The updated data is recorded on the chart, which visually illustrates the daily changes.
3) Track the Remaining Work
Record the total work still remaining at regular intervals during the Sprint. The actual burndown line reflects these values and shows how the team's progress changes over time
4) Acquire the Final Dataset
As the Sprint progresses, the chart accumulates data that reflects the team's daily updates. This dataset includes the initial estimates, daily reductions in work remaining, and any fluctuations caused by changes in scope, impediments, or unexpected events.
5) Plot and Review the Burndown Chart
Plot the remaining work on the vertical axis against Sprint days on the horizontal axis. Update the chart throughout the Sprint and review the actual burndown trend against the expected progress to understand how work is advancing.
Develop scrum leadership skills our Scrum Master Certification Training - Join today!
Benefits of a Sprint Burndown Chart
A sprint burndown chart can help Scrum Teams understand how work is progressing during a Sprint. Key benefits include:
1) Improves Visibility: Gives a quick visual view of how much work remains.
2) Highlights Progress Trends: Shows whether remaining work is decreasing as the Sprint progresses.
3) Identifies Issues Early: Flat or rising lines can highlight blockers, scope changes, or other concerns.
4) Supports Daily Discussions: Provides useful context for conversations about progress and impediments.
5) Encourages Transparency: Makes the current state of Sprint work easier for the Scrum Team to understand.
6) Supports Forecasting: Helps the team assess whether the remaining work appears manageable within the Sprint.
7) Reveals Scope Changes: Increases in remaining work can make added or re-estimated work more visible.
Trainer’s Insight
A useful burndown chart should encourage discussion, not judgement. Focus on what the pattern reveals about the Sprint plan and whether the team needs to adapt its approach.

Nilotpal Sarmah is a Senior Content Writer with 11+ years of overall experience spanning engineering, operations and content development. His technical knowledge and extensive writing experience enable him to simplify specialised topics across IT and Tech, Business Skills, Project Management, Health and Safety, and ISO and Compliance.
View Detail

 If you wish to make any changes to your course, please


