Get a custom course package
We may not have any package deals available including this course. If you enquire or give us a call on +61 272026926 and speak to our training experts, we should be able to help you with your requirements.
Module 1: Python for Data Analysis - NumPy
Module 2: Python for Data Analysis – Pandas
Module 3: Python for Data Visualisation – Matplotlib
Module 4: Python for Data Visualisation – Seaborn
Module 5: Machine Learning
Module 6: Natural Language Processing
Module 7: Deep Learning
Module 8: Big Data
Module 9: Working with Data in R
Module 10: Regression in R
Module 11: Modelling Data
Module 12: Shaping and Combining Data using Power BI
Module 13: Interactive Data Visualisations


This Advanced Data Science Certification Course is tailored for individuals seeking to enhance their expertise in the field of data science. This training is particularly beneficial for professionals such as:
There are no formal prerequisites for the Advanced Data Science Certification Course. However, having prior knowledge of multiple programming languages will be beneficial for the delegates.
In today's data-driven world, the demand for professionals with expertise in data science is soaring, and this Advanced Data Science Certification stands as a beacon for individuals seeking to navigate the intricate landscape of data science. Covering critical topics such as NumPy arrays, regression analysis, machine learning mathematics, and more, this training provides a robust foundation for those eager to harness the power of data.
Business Analysts, Data Engineers, Software Developers, and even executives can benefit significantly from mastering data science. In an era where every bit of data holds invaluable insights, those well-versed in data science possess a distinct advantage. They can unravel complex patterns, make informed decisions, and drive innovation.
This 4-day Advanced Data Science Certification Course is designed to empower delegates with practical knowledge and hands-on skills. It delves into essential concepts such as working with time series, three-dimensional plotting, data analytics lifecycle phases, and data manipulation using Power BI. By the end of this training, delegates will emerge as adept data scientists capable of working with data at expert-level
Course Objectives
Upon completion of this training, delegates will not only possess a solid foundation in data science but also practical skills in tools like Pandas and Power BI. This empowers them to analyse data effectively, make informed decisions, and contribute meaningfully to their organisations' success.


Why choose us
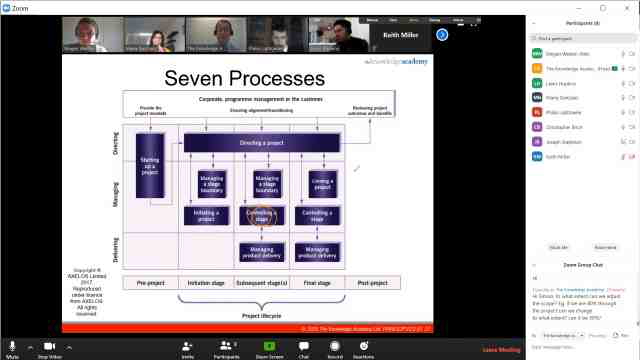
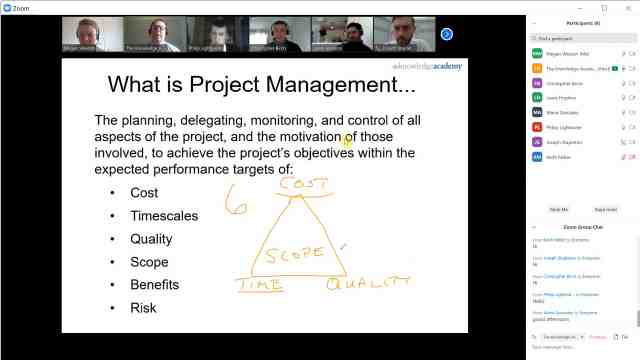
Experience live, interactive learning from home with The Knowledge Academy's Online Instructor-led Advanced Data Science Certification. Engage directly with expert instructors, mirroring the classroom schedule for a comprehensive learning journey. Enjoy the convenience of virtual learning without compromising on the quality of interaction.
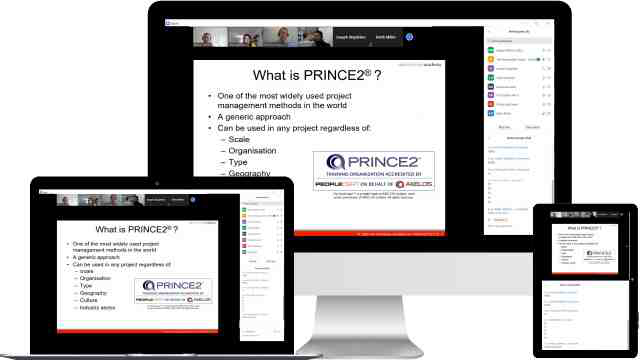

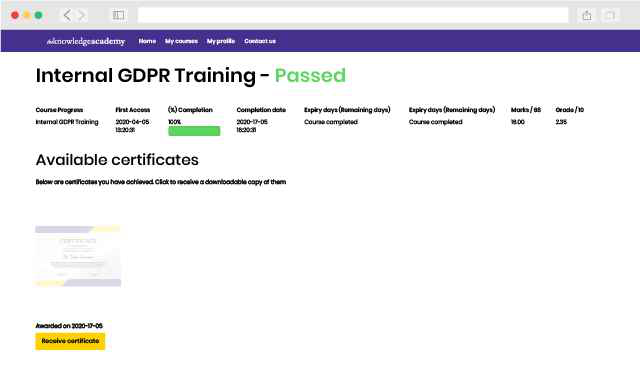
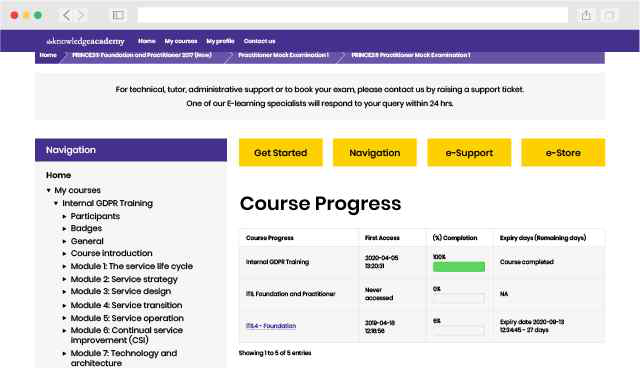
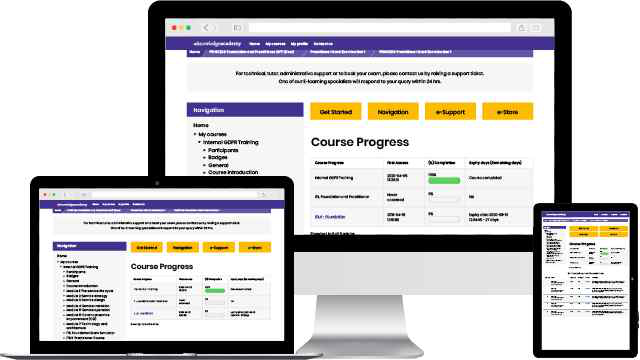
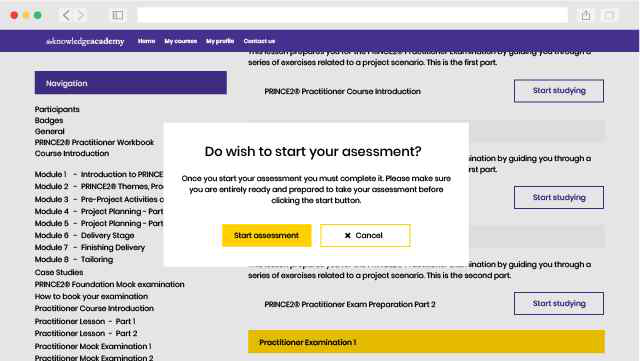
Unlock your potential with The Knowledge Academy's Advanced Data Science Certification, accessible anytime, anywhere on any device. Enjoy 90 days of online course access, extendable upon request, and benefit from the support of our expert trainers. Elevate your skills at your own pace with our Online Self-paced sessions.
Experience the most sought-after learning style with The Knowledge Academy's Advanced Data Science Certification. Available in 490+ locations across 190+ countries, our hand-picked Classroom venues offer an invaluable human touch. Immerse yourself in a comprehensive, interactive experience with our expert-led Advanced Data Science Certification sessions.

Boost your skills with our expert trainers, boasting 10+ years of real-world experience, ensuring an engaging and informative training experience

We only use the highest standard of learning facilities to make sure your experience is as comfortable and distraction-free as possible

Our Classroom courses with limited class sizes foster discussions and provide a personalised, interactive learning environment

Achieve certification without breaking the bank. Find a lower price elsewhere? We'll match it to guarantee you the best value
Streamline large-scale training requirements with The Knowledge Academy’s In-house/Onsite Advanced Data Science Certification at your business premises. Experience expert-led classroom learning from the comfort of your workplace and engage professional development.

Leverage benefits offered from a certification that fits your unique business or project needs

Cut unnecessary costs and focus your entire budget on what really matters, the training.

Our Advanced Data Science Certification offers a unique chance for your team to bond and engage in discussions, enriching the learning experience beyond traditional classroom settings

The course know-how will help you track and evaluate your employees' progression and performance with relative ease
great professor!
There hasn't been any questions asked about this Topic


You won't find better value in the marketplace. If you do find a lower price, we will beat it.

Flexible delivery methods are available depending on your learning style.

Resources are included for a comprehensive learning experience.


"Really good course and well organised. Trainer was great with a sense of humour - his experience allowed a free flowing course, structured to help you gain as much information & relevant experience whilst helping prepare you for the exam"
Joshua Davies, Thames Water


 Back to course information
We may not have any package deals available including this course. If you enquire or give us a call on +61 272026926 and speak to our training experts, we should be able to help you with your requirements.
 If you miss out, enquire to get yourself on the waiting list for the next day!

close


Press esc to close

close
Fill out your contact details below and our training experts will be in touch.


Back to Course Information