Get a custom course package
We may not have any package deals available including this course. If you enquire or give us a call on +1 7204454674 and speak to our training experts, we should be able to help you with your requirements.
Module 1: Dashboards with Power BI
Module 2: Dashboards with Excel
Module 3: Dashboards with Tableau


The Building Interactive Dashboards Course in the United States is designed for individuals who want to learn how to design and create dynamic and interactive dashboards for data visualization and analysis. This course will benefit professionals, such as:
There are no formal prerequisites for attending this Building Interactive Dashboards Course. However, a basic knowledge of computers, data visualization, and Excel can be beneficial.
The Building Interactive Dashboards Course in the United States is a dynamic exploration of creating visually compelling and user-friendly dashboards. Dashboards have become integral tools for decision-makers, allowing them to interact with and interpret complex data sets efficiently. This course delves into the art of designing interactive dashboards with real-world relevance.
Professionals in data analysis, business intelligence, project management, and strategic planning should prioritize mastering the creation of interactive dashboards. These dashboards serve as central hubs for data-driven decision-making, enabling professionals to gain insights, monitor key metrics, and communicate complex information effectively. The ability to build such dashboards is crucial for individuals aiming to enhance their analytical skills and contribute to informed decision-making processes within their organizations.
In this 1-day training in the United States by The Knowledge Academy, delegates will gain hands-on experience in constructing interactive dashboards. The course covers dashboard design principles, data visualization techniques, and tools for interactivity. Delegates in the United States will learn to transform raw data into meaningful insights, creating dashboards that not only inform but also engage users effectively.
Course Objectives
Upon completion of this course in the United States, delegates will gain the ability to create visually appealing and user-friendly dashboards. Whether in data analysis, business intelligence, or project management, delegates will leverage their newfound skills to design dashboards that facilitate efficient decision-making and enhance overall organizational performance.


Why choose us
Experience live, interactive learning from home with The Knowledge Academy's Online Instructor-led Building Interactive Dashboards Training. Engage directly with expert instructors, mirroring the classroom schedule for a comprehensive learning journey. Enjoy the convenience of virtual learning without compromising on the quality of interaction.
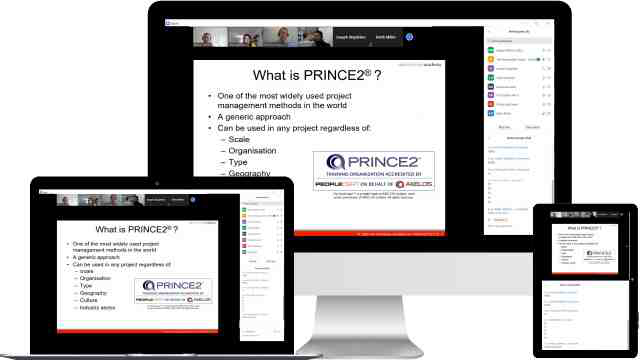
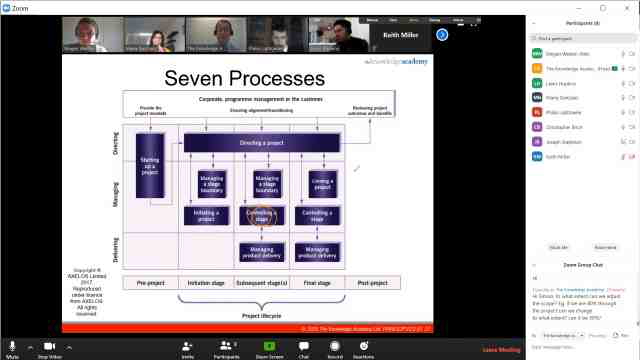
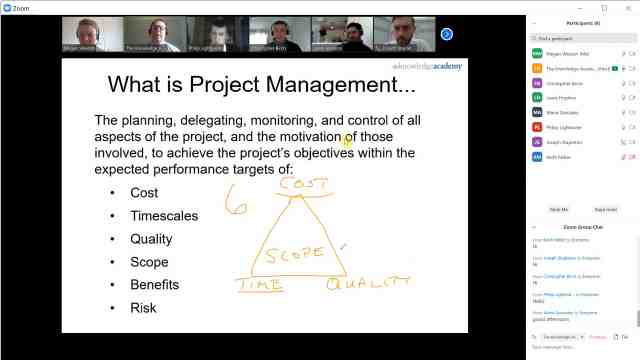

Unlock your potential with The Knowledge Academy's Building Interactive Dashboards Training, accessible anytime, anywhere on any device. Enjoy 90 days of online course access, extendable upon request, and benefit from the support of our expert trainers. Elevate your skills at your own pace with our Online Self-paced sessions.
good training experience
There hasn't been any questions asked about this Topic


You won't find better value in the marketplace. If you do find a lower price, we will beat it.

Flexible delivery methods are available depending on your learning style.

Resources are included for a comprehensive learning experience.


"Really good course and well organised. Trainer was great with a sense of humour - his experience allowed a free flowing course, structured to help you gain as much information & relevant experience whilst helping prepare you for the exam"
Joshua Davies, Thames Water


 Atlanta
 New York
 Houston
 Dallas
 Denver
 Seattle
 Los Angeles
 Chicago
 San Francisco
 Philadelphia
 San Diego
 Phoenix
 Boston
 Austin
 Detroit
 San Jose
 Tampa
Tampa Colorado Springs
 Portland
 Sacramento
 Minneapolis
 San Antonio
 Irvine
 Las Vegas
 Miami
Miami Bellevue
 Pittsburgh
 Baltimore
 Fairfax
 Orlando
 Raleigh
 Salt Lake City
 Columbus
 Oklahoma City
 Nashville
 Charleston
 Columbia
 Cleveland
 Cincinnati
 Memphis
 Richmond
 Virginia Beach
 Louisville
 Fort Lauderdale
 Indianapolis
 Des Moines
 Grand Rapids
 New Orleans
 Wichita
 Charlotte
 Hartford
 New Jersey
 Anchorage
 Omaha
Omaha Honolulu
 Albuquerque
 Baton Rouge
 Iowa City
 Albany, NY
 Boise
Boise Milwaukee
 Tucson
 Kansas City
 St Louis
 Jacksonville
 Back to course information
We may not have any package deals available including this course. If you enquire or give us a call on +1 7204454674 and speak to our training experts, we should be able to help you with your requirements.
 If you miss out, enquire to get yourself on the waiting list for the next day!

close


Press esc to close

close
Fill out your contact details below and our training experts will be in touch.


Back to Course Information