


 Top Rated Course


We may not have the course you’re looking for. If you enquire or give us a call on +47 80010068 and speak to our training experts, we may still be able to help with your training requirements.
Grafana vs Datadog: Features, Pricing & Which to Choose in 2026
Richard Harris 20 March 2026Datadog is a managed SaaS platform with built-in logs, APM, and infrastructure tools. Grafana is open-source, flexible, and lower cost, but needs setup. Datadog is easier to start and manage, with minimal setup and built-in features. Grafana offers more customisation and control, but requires setup, integration, and ongoing maintenance.

Training Outcomes Within Your Budget!
We ensure quality, budget-alignment, and timely delivery by our expert instructors.
Table of Contents
Monitoring tools can make or break how effectively teams understand and manage their systems. From tracking performance to resolving issues faster, the right platform plays a key role in keeping everything running smoothly. This is where the debate around Grafana vs Datadog often comes into focus.
While both Grafana and Datadog offer powerful capabilities, they differ in approach, flexibility, and ease of use. Understanding these differences can help you choose the right fit for your needs, so let’s explore how they compare.
Table of Contents
1) What is Datadog?
2) What is Grafana?
3) Datadog vs Grafana: Key Differences
4) Grafana vs Datadog: How to Choose?
5) Conclusion
What is DataDog?
Datadog is an observability and monitoring cloud service that is used to give a cohesive perspective on the services, infrastructure, and applications. It unites metrics, logs, traces, and APM into a single interface to assist teams in monitoring performance and troubleshooting problems easily.
It has a minimal set up and it gathers information using in-built integrations in cloud environments and tools. Being a full-fledged SaaS product, it eliminates the aspect of infrastructure maintenance thereby allowing the teams to concentrate on development.

What is Grafana?
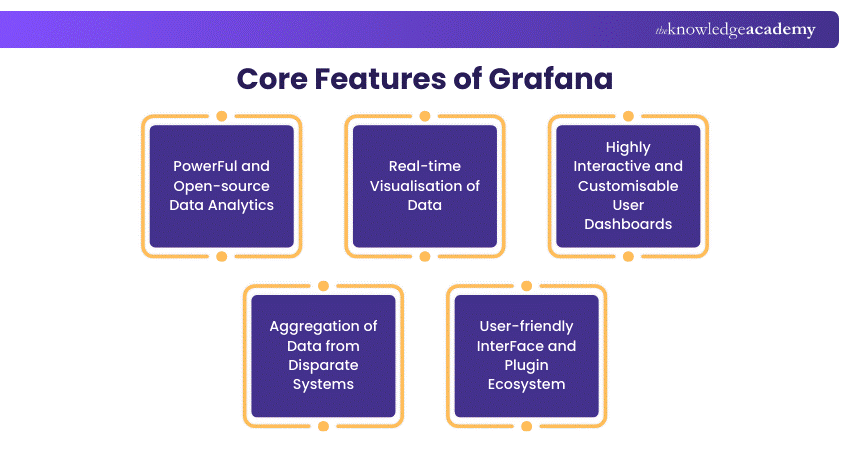
Grafana is an open-source monitoring and visualisation platform known for its flexibility and customisation. It connects to multiple data sources and enables teams to build interactive dashboards that turn complex data into clear, actionable insights.
It does not collect data on its own but integrates with tools like Prometheus and Elasticsearch to display metrics, logs, and traces in one place. This makes it ideal for teams that want full control over their observability setup, though it typically requires more configuration and maintenance.
Master data-driven insights through Business Intelligence Analyst Training - Sign up today!
Datadog vs Grafana: Key Differences
Being aware of the distinctions between Datadog and Grafana can lead to the selection of the proper monitoring tool. The following points summarise their primary differences in terms of features, usability, and performance.
1) Primary Features and Use Cases
Grafana is primarily a visualisation and analytics tool designed to create interactive dashboards using data from multiple sources. It enables teams to explore metrics, logs, and performance data in a highly customisable way, making it especially useful for organisations that prioritise flexibility and detailed data representation. Its strength lies in transforming complex datasets into meaningful insights through tailored visual panels and queries.
Datadog, on the other hand, is a comprehensive monitoring and observability platform that provides end-to-end visibility across infrastructure, applications, and services. It includes built-in capabilities such as real-time monitoring, anomaly detection, and automated alerting, making it well-suited for organisations that need a unified solution for performance tracking and operational intelligence.
Gain expertise in Power BI- Register for our Microsoft Power BI Course today!
2) Usability and Interface
Grafana offers a clean, dashboard-centric interface with extensive customisation options, allowing users to design visualisations that meet specific operational needs. While this flexibility is a major advantage, it often requires familiarity with query languages and data source configurations, which can present a learning curve for beginners or non-technical users.
Datadog provides a more intuitive and user-friendly interface with pre-built dashboards and streamlined navigation. Its out-of-the-box features reduce the need for manual setup, enabling teams to quickly start monitoring systems without deep technical expertise, which enhances overall productivity and ease of use.
3) Integrations
Grafana supports a wide variety of data sources, including cloud services, databases, and monitoring tools, making it highly adaptable to different environments. It uses plugins and APIs to connect with external systems, allowing users to integrate and visualise data from virtually any platform within a single interface.
Datadog offers extensive native integrations with hundreds of technologies, including cloud providers, containers, and third-party services. These integrations come with pre-configured dashboards and metrics, enabling organisations to centralise monitoring data quickly and efficiently without extensive configuration efforts.
4) Customer Support
Grafana benefits from a strong open-source community that contributes to extensive documentation, forums, and shared resources. Users can access community-driven support, tutorials, and plugins, while enterprise users have the option to receive dedicated assistance through paid plans.
Datadog provides structured and professional customer support, including detailed documentation, knowledge bases, and direct assistance for paid users. This ensures quicker issue resolution and reliable guidance, although free-tier users may have limited access to advanced support services.
5) Pricing
Grafana follows a flexible pricing model with a free open-source version available, making it an attractive option for organisations with budget constraints. Additional enterprise features, hosting, and support services are available through paid subscriptions, allowing businesses to scale based on their needs.
Datadog operates on a subscription-based pricing model, typically determined by the number of hosts, services, and data usage. While it offers a wide range of advanced features, costs can increase significantly as infrastructure grows, making it important for organisations to carefully manage usage.
6) Security
Grafana includes core security features such as role-based access control, authentication, and data encryption. However, as it is often self-hosted, organisations are responsible for implementing and maintaining security configurations, updates, and compliance measures.
Datadog provides built-in security features as part of its cloud-based service, including encryption, multi-factor authentication, and compliance with industry standards. Since it is a managed platform, it handles infrastructure security and updates automatically, reducing the operational burden on internal teams.
Grafana vs Datadog: How to Choose?
The decision between Grafana and Datadog is based on the needs, skills and financial capacity. Grafana is more appropriate to the teams that need a flexible and customised dashboard, whereas Datadog is the most suitable option regarding full-stack monitoring and the built-in capabilities and quicker installation.
Datadog is simpler to install with pre-built integrations whereas Grafana is controlled more but requires configuration and maintenance. Price and security are also relevant, whereby Grafana is cheaper and Datadog offers a managed growth and security.
Conclusion
Choosing between Grafana and Datadog depends on your team’s needs and priorities. While both offer strong monitoring capabilities, the right choice comes down to flexibility versus convenience. Understanding Grafana vs Datadog helps you make a confident, scalable decision.
Master Qlik Sense for advanced data analytics skills- Join our Qlik Sense Training today!
Frequently Asked Questions
Does SpaceX use Grafana?

Yes, SpaceX has been observed with Grafana dashboards in its control centre, even when Falcon 9 is in operation. These dashboards aid in monitoring and visualisation of vital data in the system.
What is the Rule of 40 in Datadog?
The Rule of 40 is a SaaS metric that adds revenue growth rate and profit margin to assess performance. For Datadog, meeting or exceeding 40% indicates a strong balance between growth and profitability.
What are the Other Resources and Offers Provided by The Knowledge Academy?
The Knowledge Academy takes global learning to new heights, offering over 3,000+ online courses across 490+ locations in 190+ countries. This expansive reach ensures accessibility and convenience for learners worldwide.
Alongside our diverse Online Course Catalogue, encompassing 17 major categories, we go the extra mile by providing a plethora of free educational Online Resources like Blogs, eBooks, Interview Questions and Videos. Tailoring learning experiences further, professionals can unlock greater value through a wide range of special discounts, seasonal deals, and Exclusive Offers.
What is The Knowledge Pass, and How Does it Work?
The Knowledge Academy’s Knowledge Pass, a prepaid voucher, adds another layer of flexibility, allowing course bookings over a 12-month period. Join us on a journey where education knows no bounds.
What are the Related Courses and Blogs Provided by The Knowledge Academy?
The Knowledge Academy offers various Business Intelligence Reporting Courses, including the Business Intelligence Analyst Course, Microsoft Power BI Course, and Tableau Desktop Training. These courses cater to different skill levels, providing comprehensive insights into Business Intelligence (BI).
Our Office Applications Blogs cover a range of topics related to Datadog vs Grafana, offering valuable resources, best practices, and industry insights. Whether you are a beginner or looking to advance your Log Management and Analysis skills, The Knowledge Academy's diverse courses and informative blogs have got you covered.

Richard Harris


Senior Full Stack Developer and Technology Educator
Richard Harris is a highly experienced full-stack developer with deep expertise in both frontend and backend technologies. Over his 12-year career, he has built scalable web applications for startups, enterprises and government organisations. Richard’s writing combines technical depth with clear explanations, ideal for developers looking to grow in modern frameworks and tools.


 If you wish to make any changes to your course, please


